
Whether as a result of management or insulation, we have yet to see any persistent effects seeping through from the plethora of economic uncertainty and news around the world.
Rising interest rates – as we explored in previous issues – did result in a temporary drop in acquisitions through mid-2022 before bouncing back by end of year.
Prior to this, supply chain bottlenecks, labour shortages, and immense increases in construction costs did little to stop the emergence of the largest industrial pipeline we have ever seen.
Now, a crisis with certain financial institutions south of the border is brewing. And as long as the major institutional and private developers have dry powder and can access liquidity, this should only strengthen the value proposition of real, hard assets cash-flowing significant rental income and backed by AAA-quality tenants.
Regardless of the event, up to this point, the GTA industrial market has absorbed new deliveries and maintained upward pressure on both rents and values. While we have seen a stabilization effect with respect to industrial rents, they continue to increase, with escalations priced in at around 4%.
Values, too, are increasing, and are in many cases defying the narrative of cap rates vs. interest rates because of the enormous long-term value of the assets themselves, coupled with long-term expectations of a reversion with respect to rates.
Whatever the reason (or reasons) may be for this resilience, it is critical to examine the main drivers and outcomes in the market to filter through the noise and try to forecast where we are heading.
For this week’s newsletter, we will analyze the GTA industrial market’s historical sales pricing and growth data to gain a better understanding of how the market has evolved, and to help get a sense of what is to come.
GTA Historical Sales Pricing and Growth Analysis
As you can see below, the sales price per square foot of GTA industrial properties has proven the incredible value of ownership. In 2018, the weighted average asking sales price PSF was just $144.78… where in Q4 2022 it reached $502.61 PSF, with no clear signs that this trend will reverse course, even in light of the various economic risks.
The linear trendline further confirms the broad-stroke averages of values being in the low- to mid-400s PSF, with the understanding that individual asset valuations depend largely on specific features and location.
As alluded to earlier, as real assets are perceived to be safe havens, it is plausible to assume that fewer landlords would be willing to sell, and thus, anything available on the market (currently at 0.1% of inventory) would be subject to greater pressure on valuations. Of course, interest rates and liquidity create issues here – but – large investors sitting on cash are not subject to these limitations to the same degree.
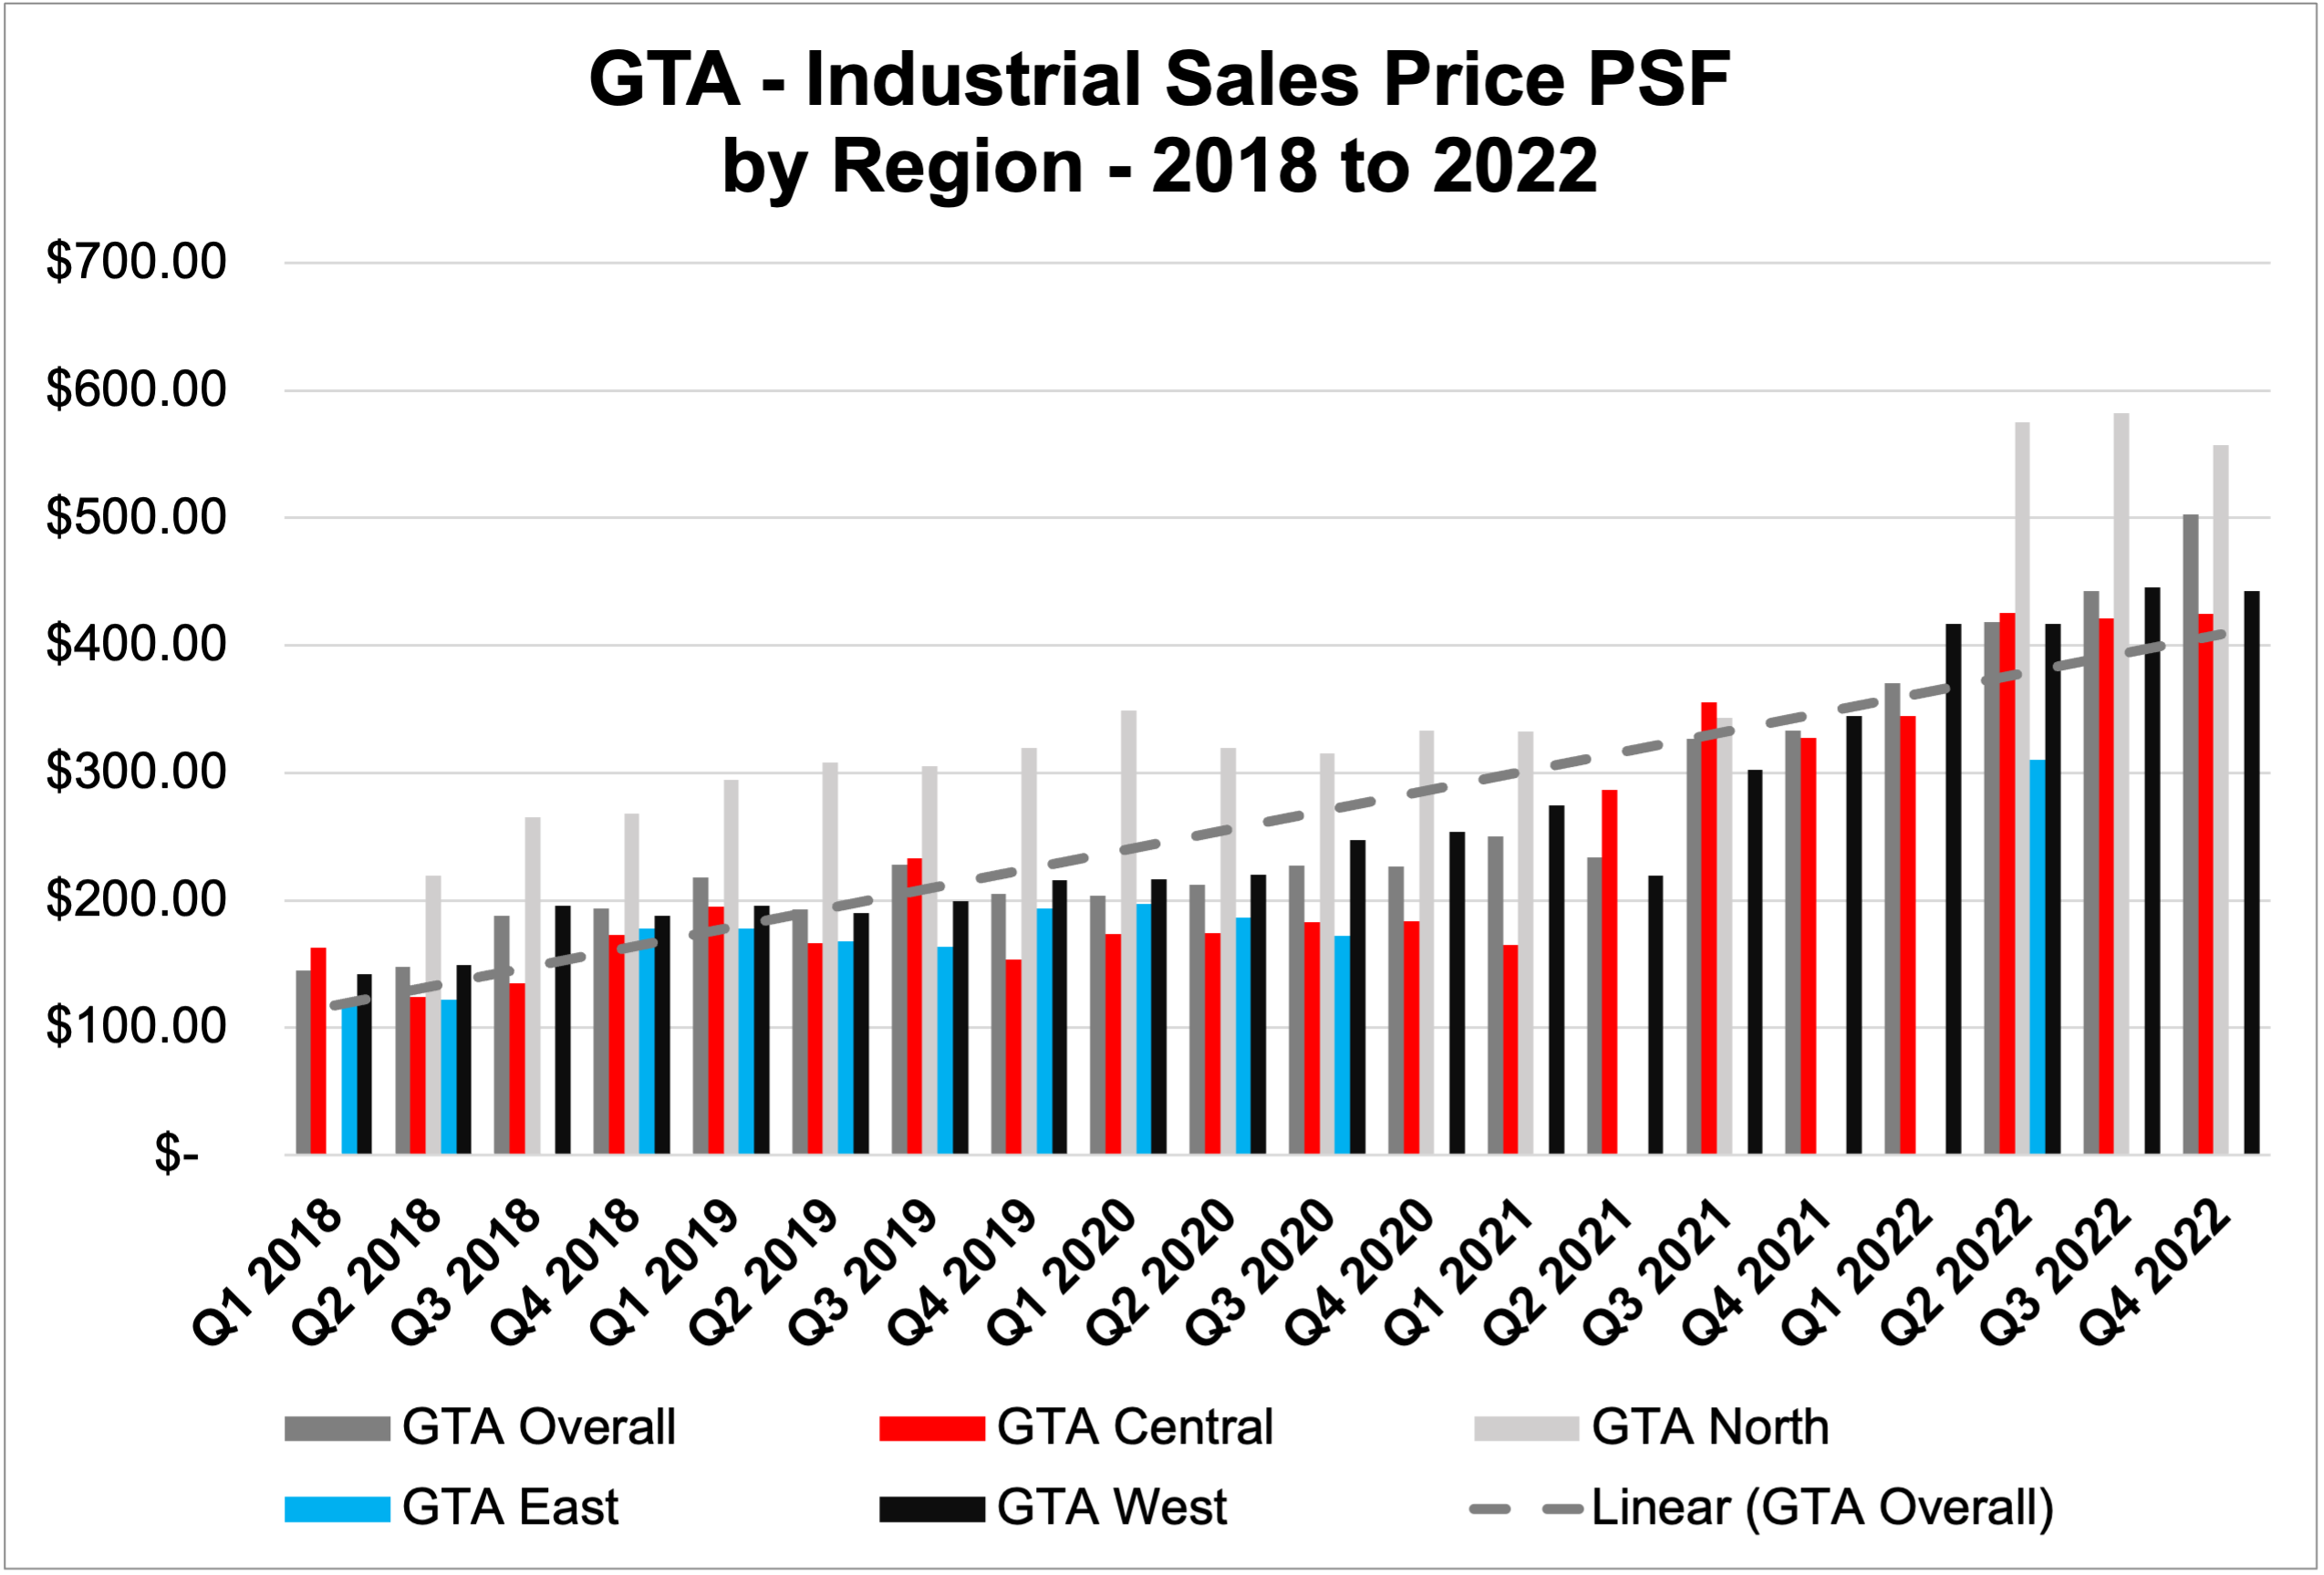
GTA Industrial Sales Price PSF by Region, 2018 to 2022. Source: Cushman & Wakefield.
GTA Historical Sales Pricing Breakdown by Region
Below, we see the differences in weighted average asking sales price PSF, as well as the quarterly sales price growth by Region.
What’s important to take away from these graphs is:
- The North and Central regional data are much more complete due to the size and activity. Because of their matureness as markets, we also find more moderate sales pricing.
- The Central and West markets provide more comparable sales data. This allows us to more clearly analyze and draw conclusions.
- The North and East markets typically have little to no inventory available for sale (and recently, even for lease). Here, we often see new developments come to market and then quickly pre-leased or absorbed.
- Specifically, in the East region, as much of the development occurred in the previous 5 or so years, very few, if any, assets have registered as industrial sales. As such, establishing valuations involves understanding net income and replacement costs more than direct comparables.
- Finally, in the North markets, we see a similar lack of inventory to the East, but with much higher values. This is because of the relative increase in development costs, the maturity of the market, and location proximal to several major 400-series highways.
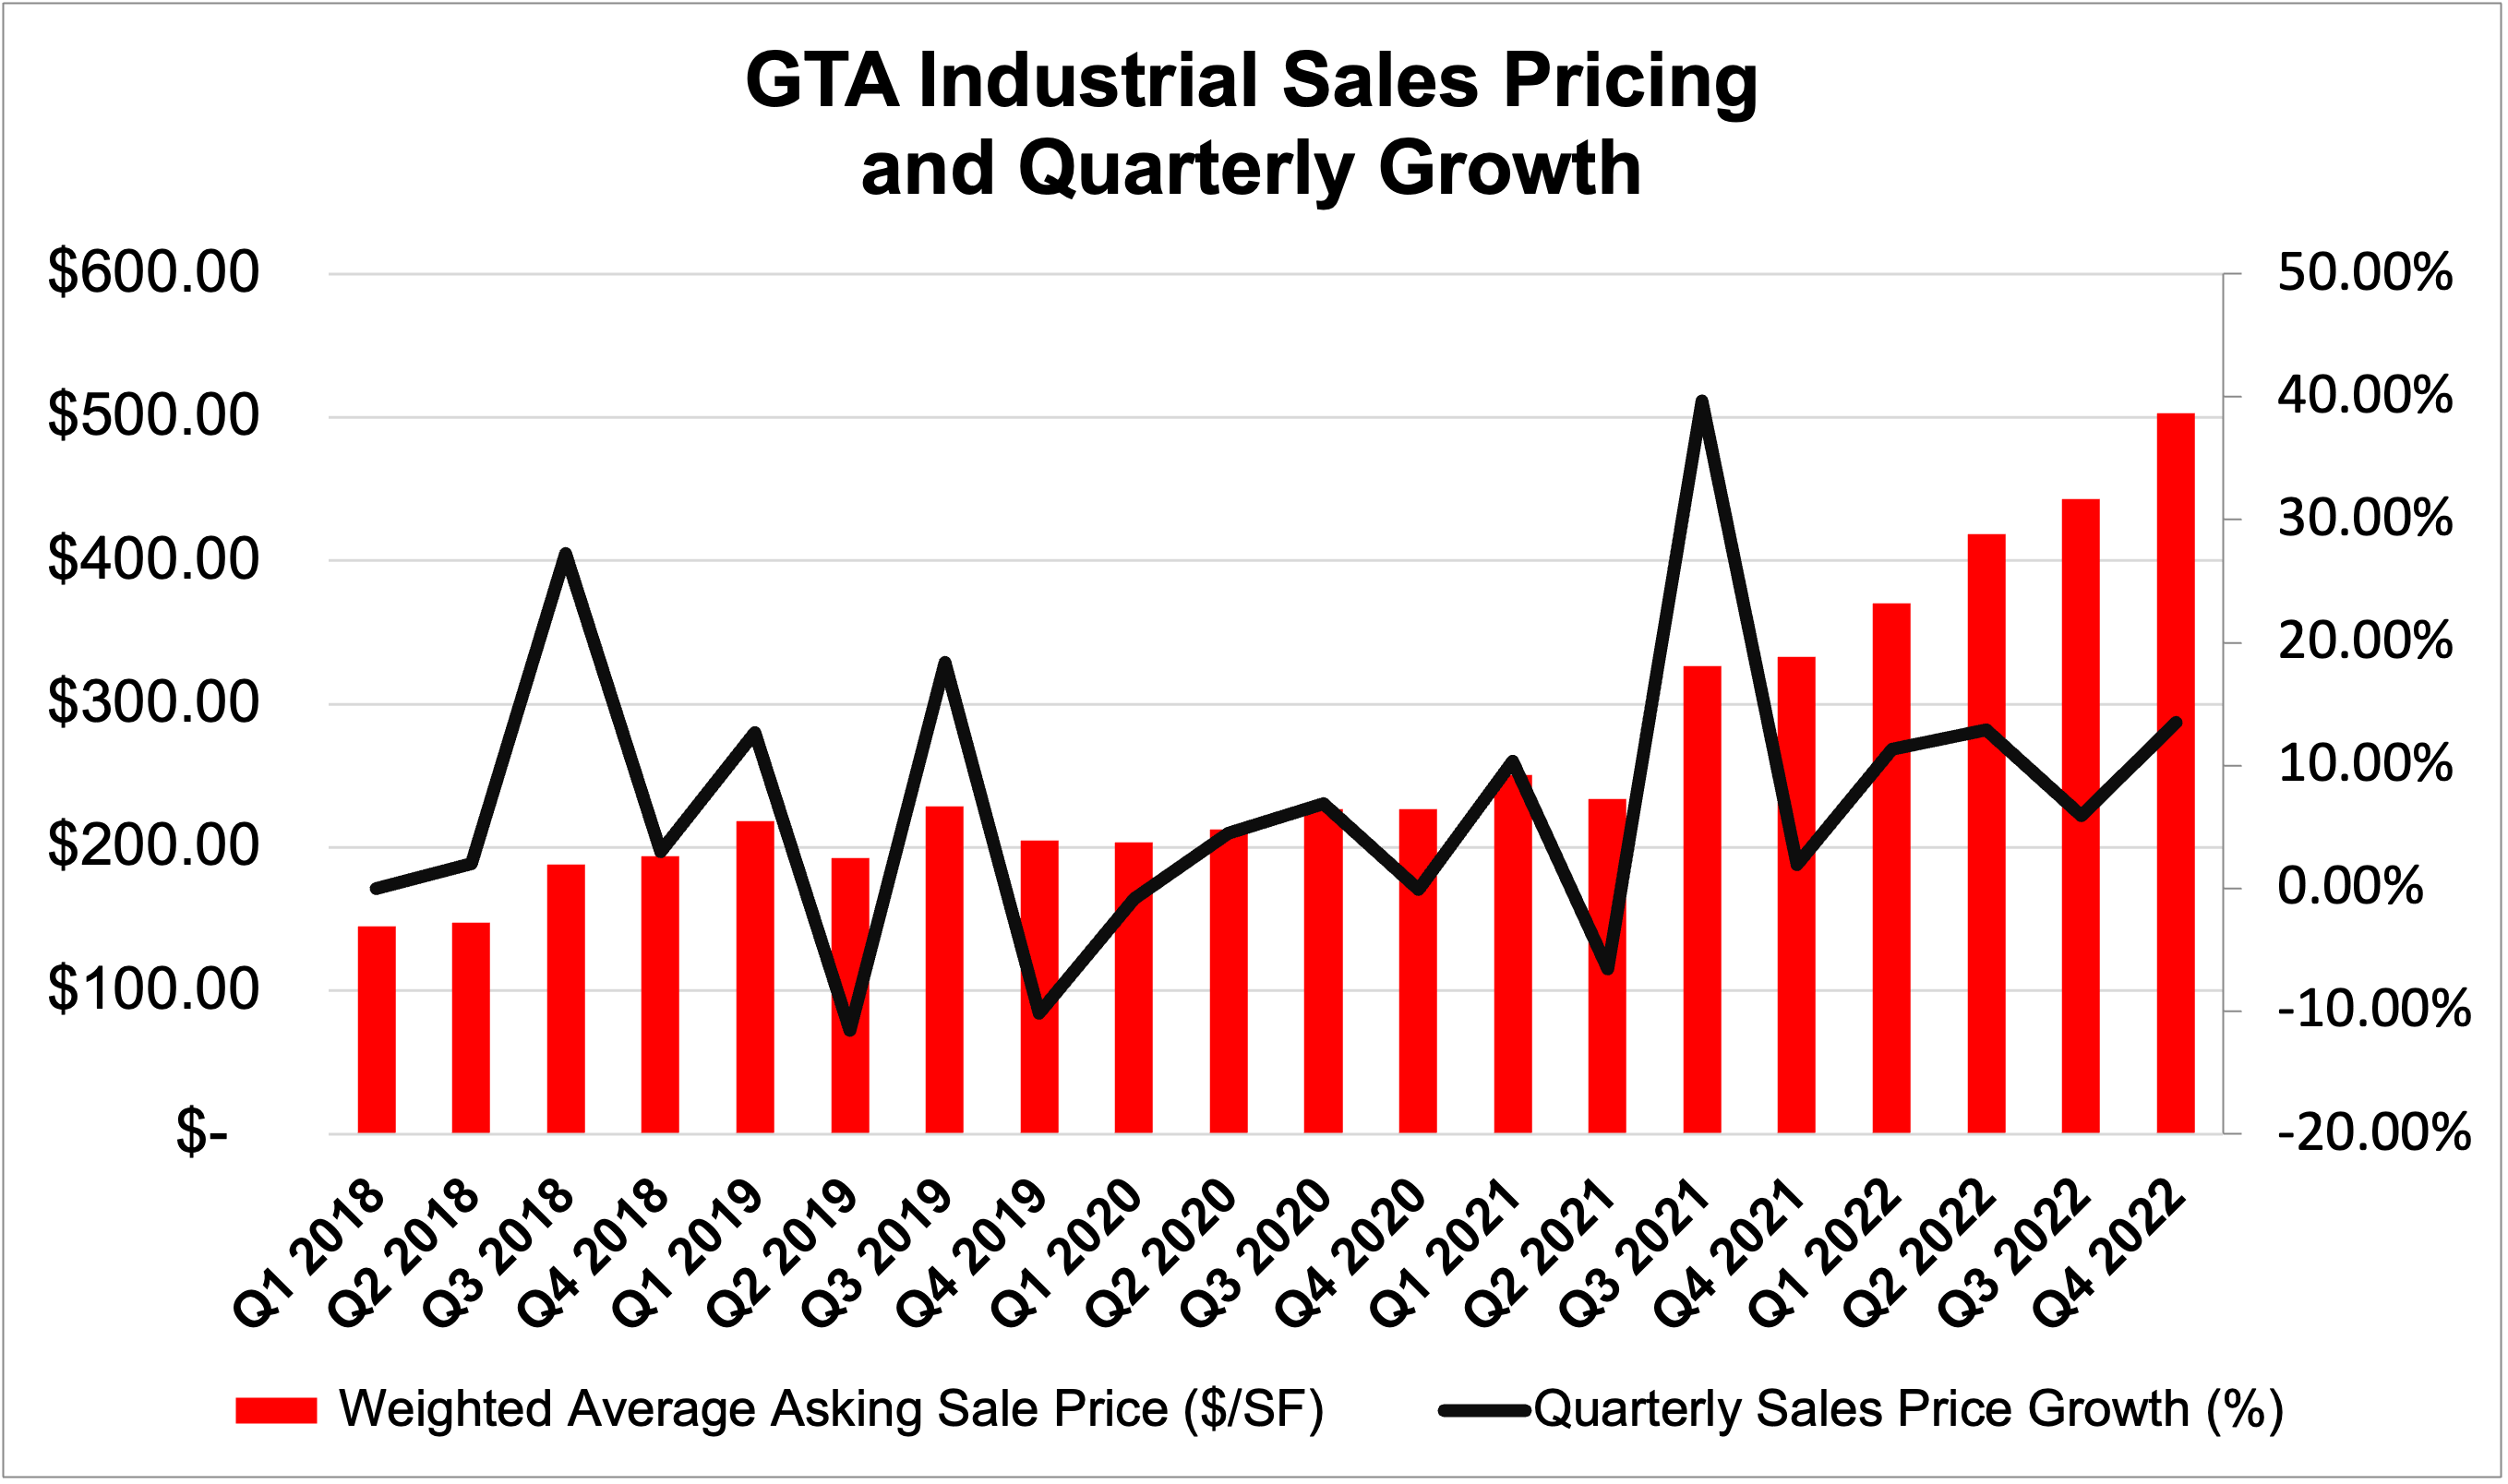
GTA Industrial Sales Pricing and Growth, 2018 to 2022. Source: Cushman & Wakefield.
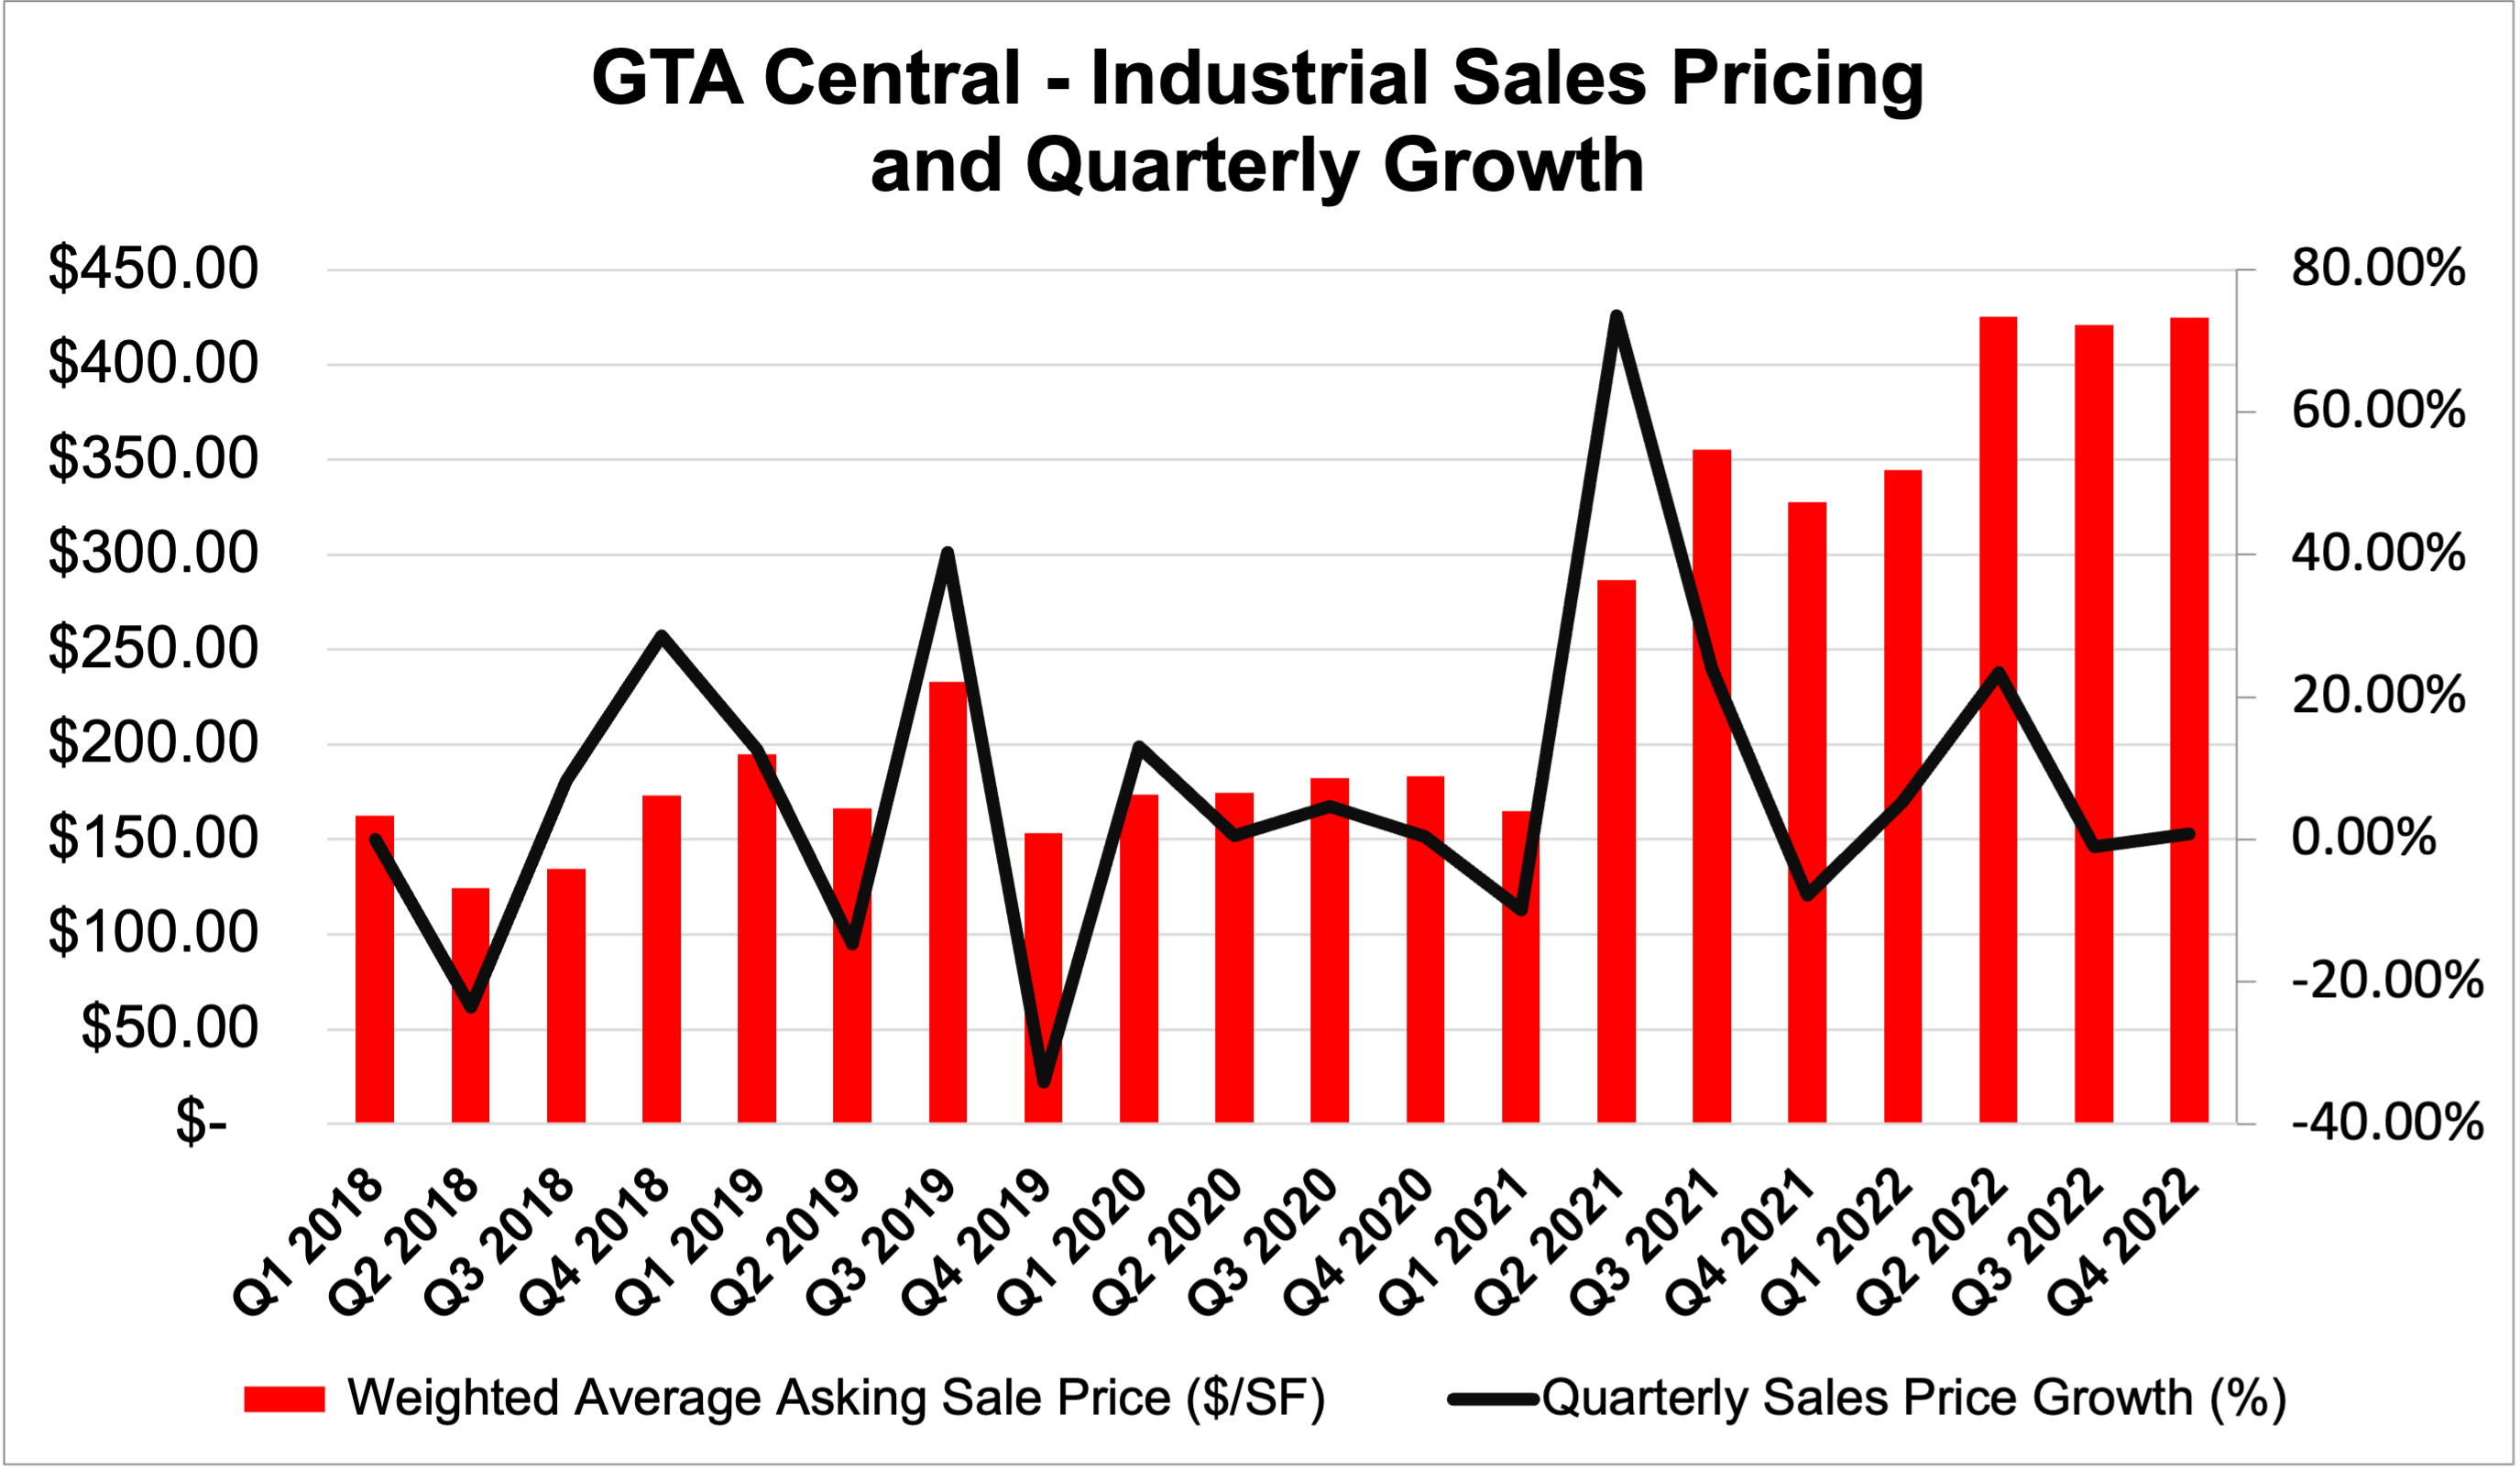
GTA Central Industrial Sales Pricing and Growth, 2018 to 2022. Source: Cushman & Wakefield.
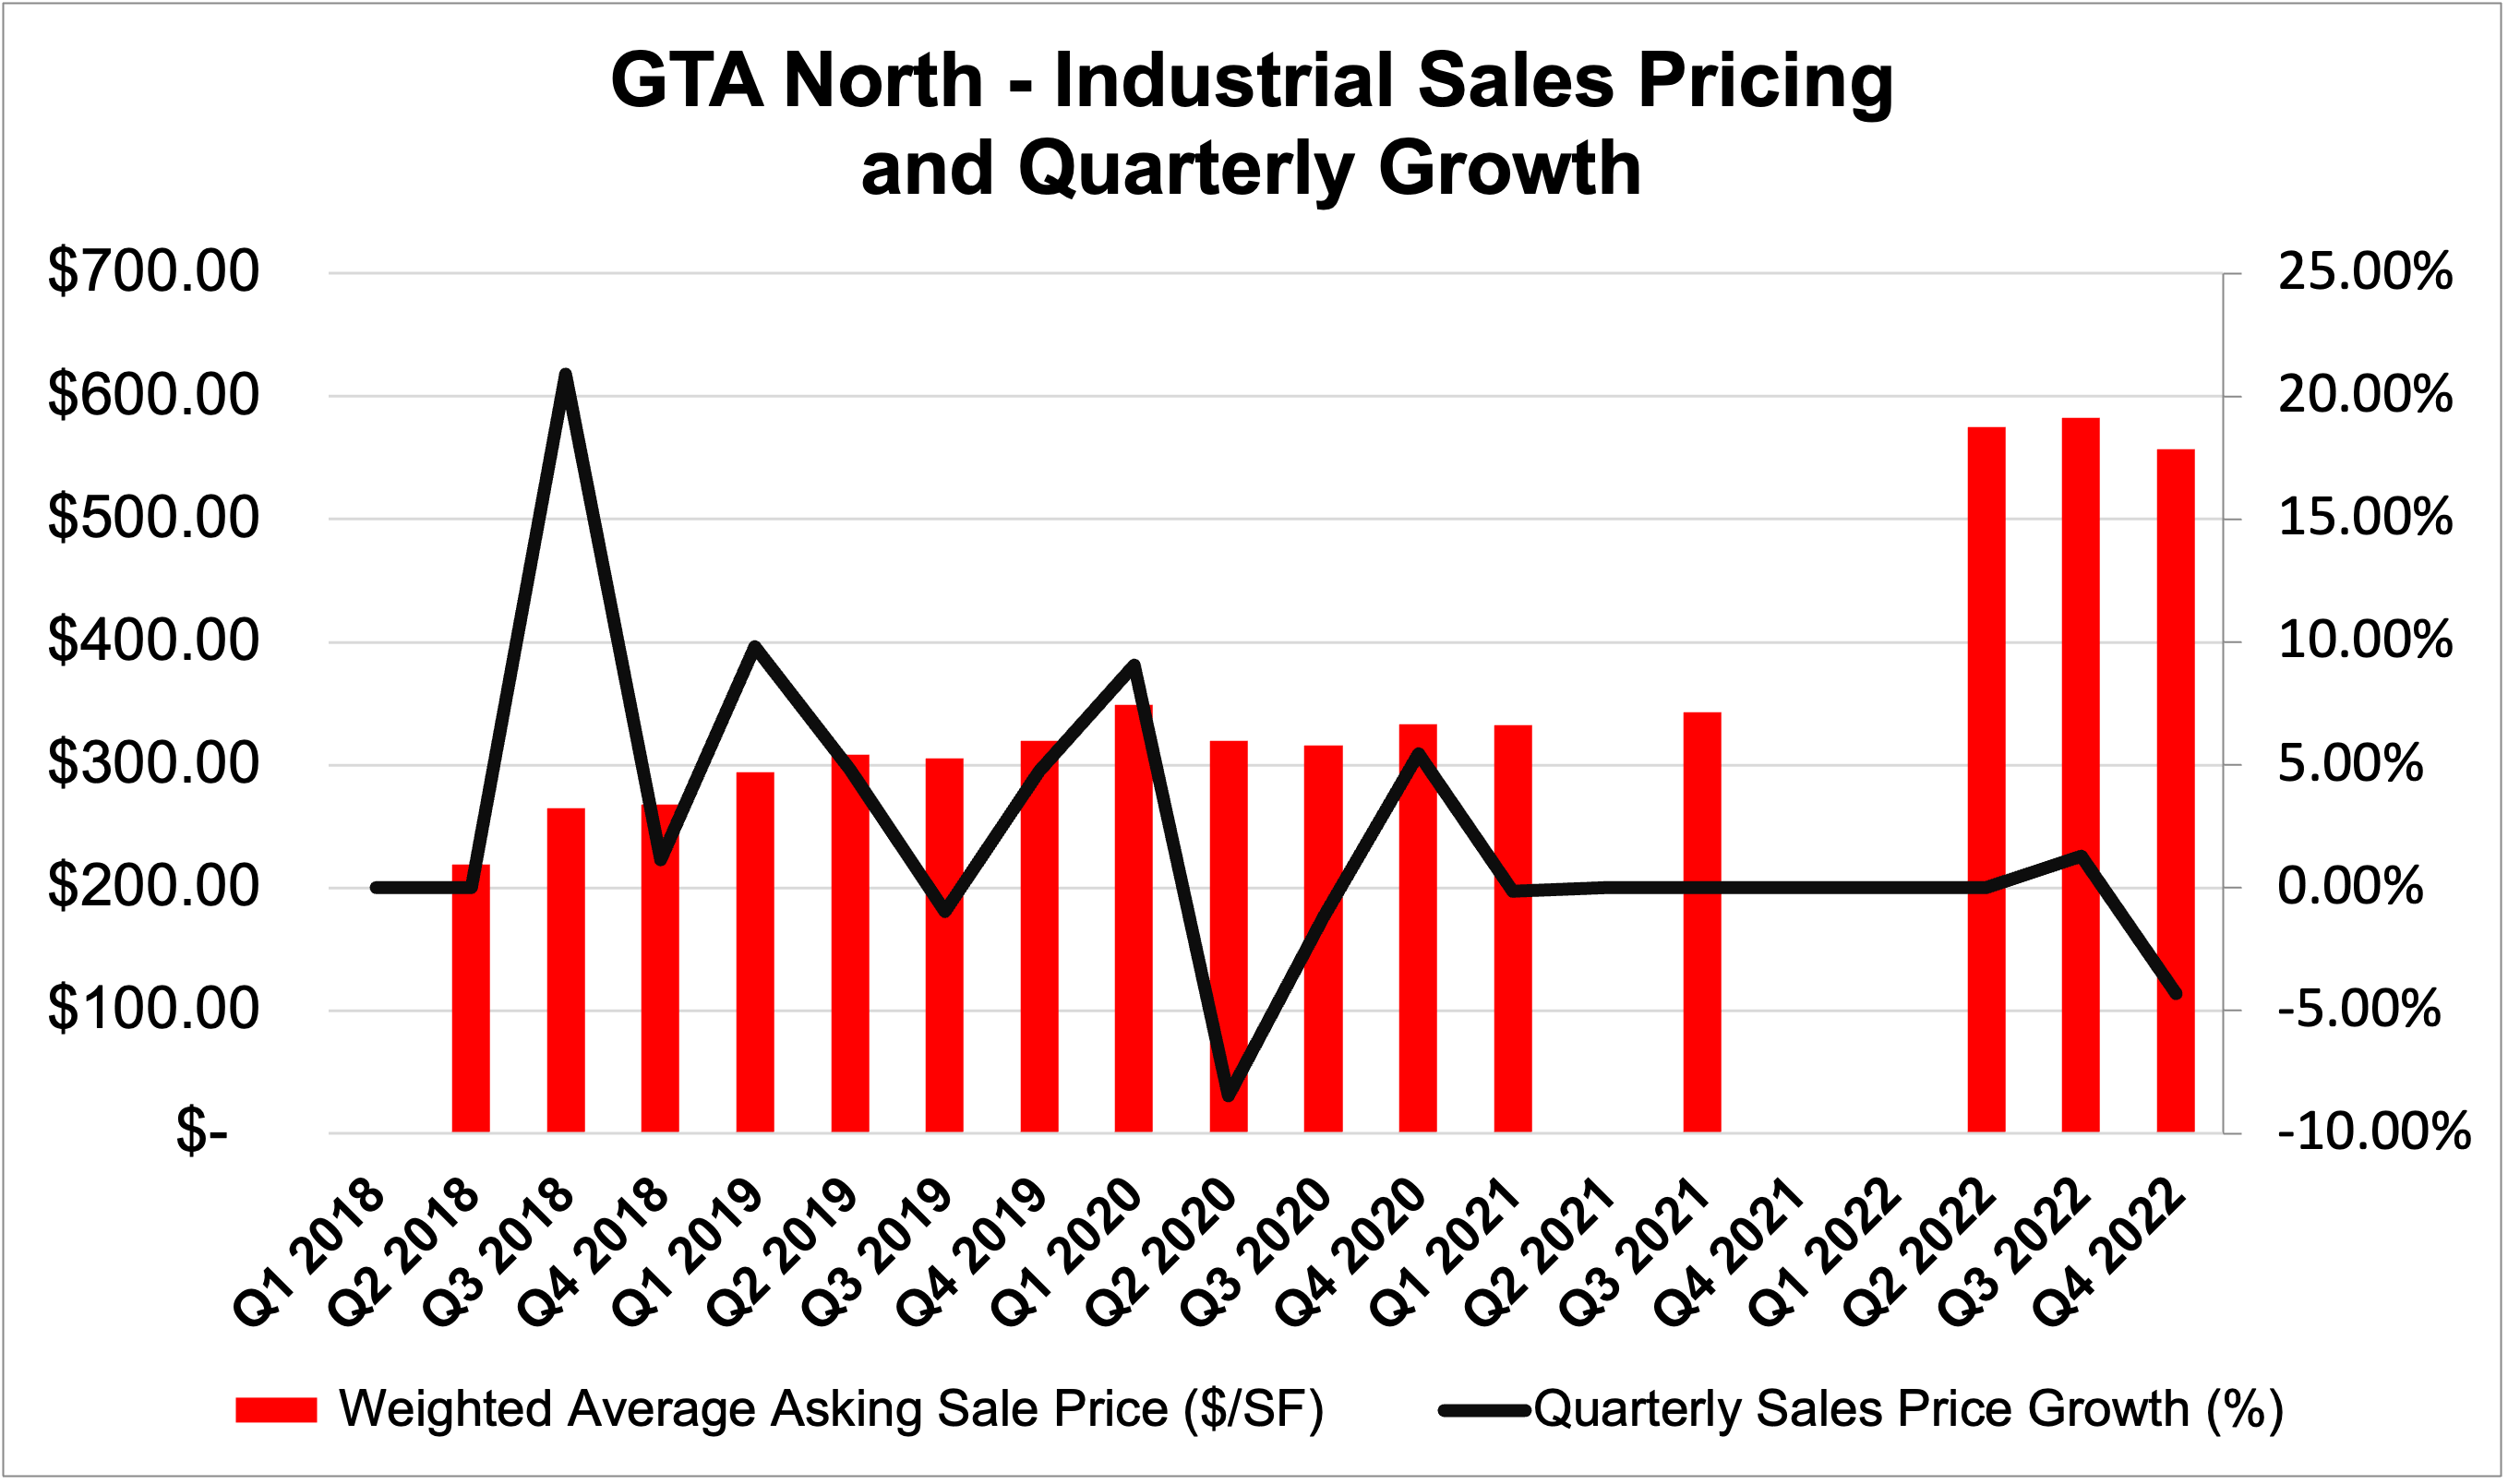
GTA North Industrial Sales Pricing and Growth, 2018 to 2022. Source: Cushman & Wakefield.
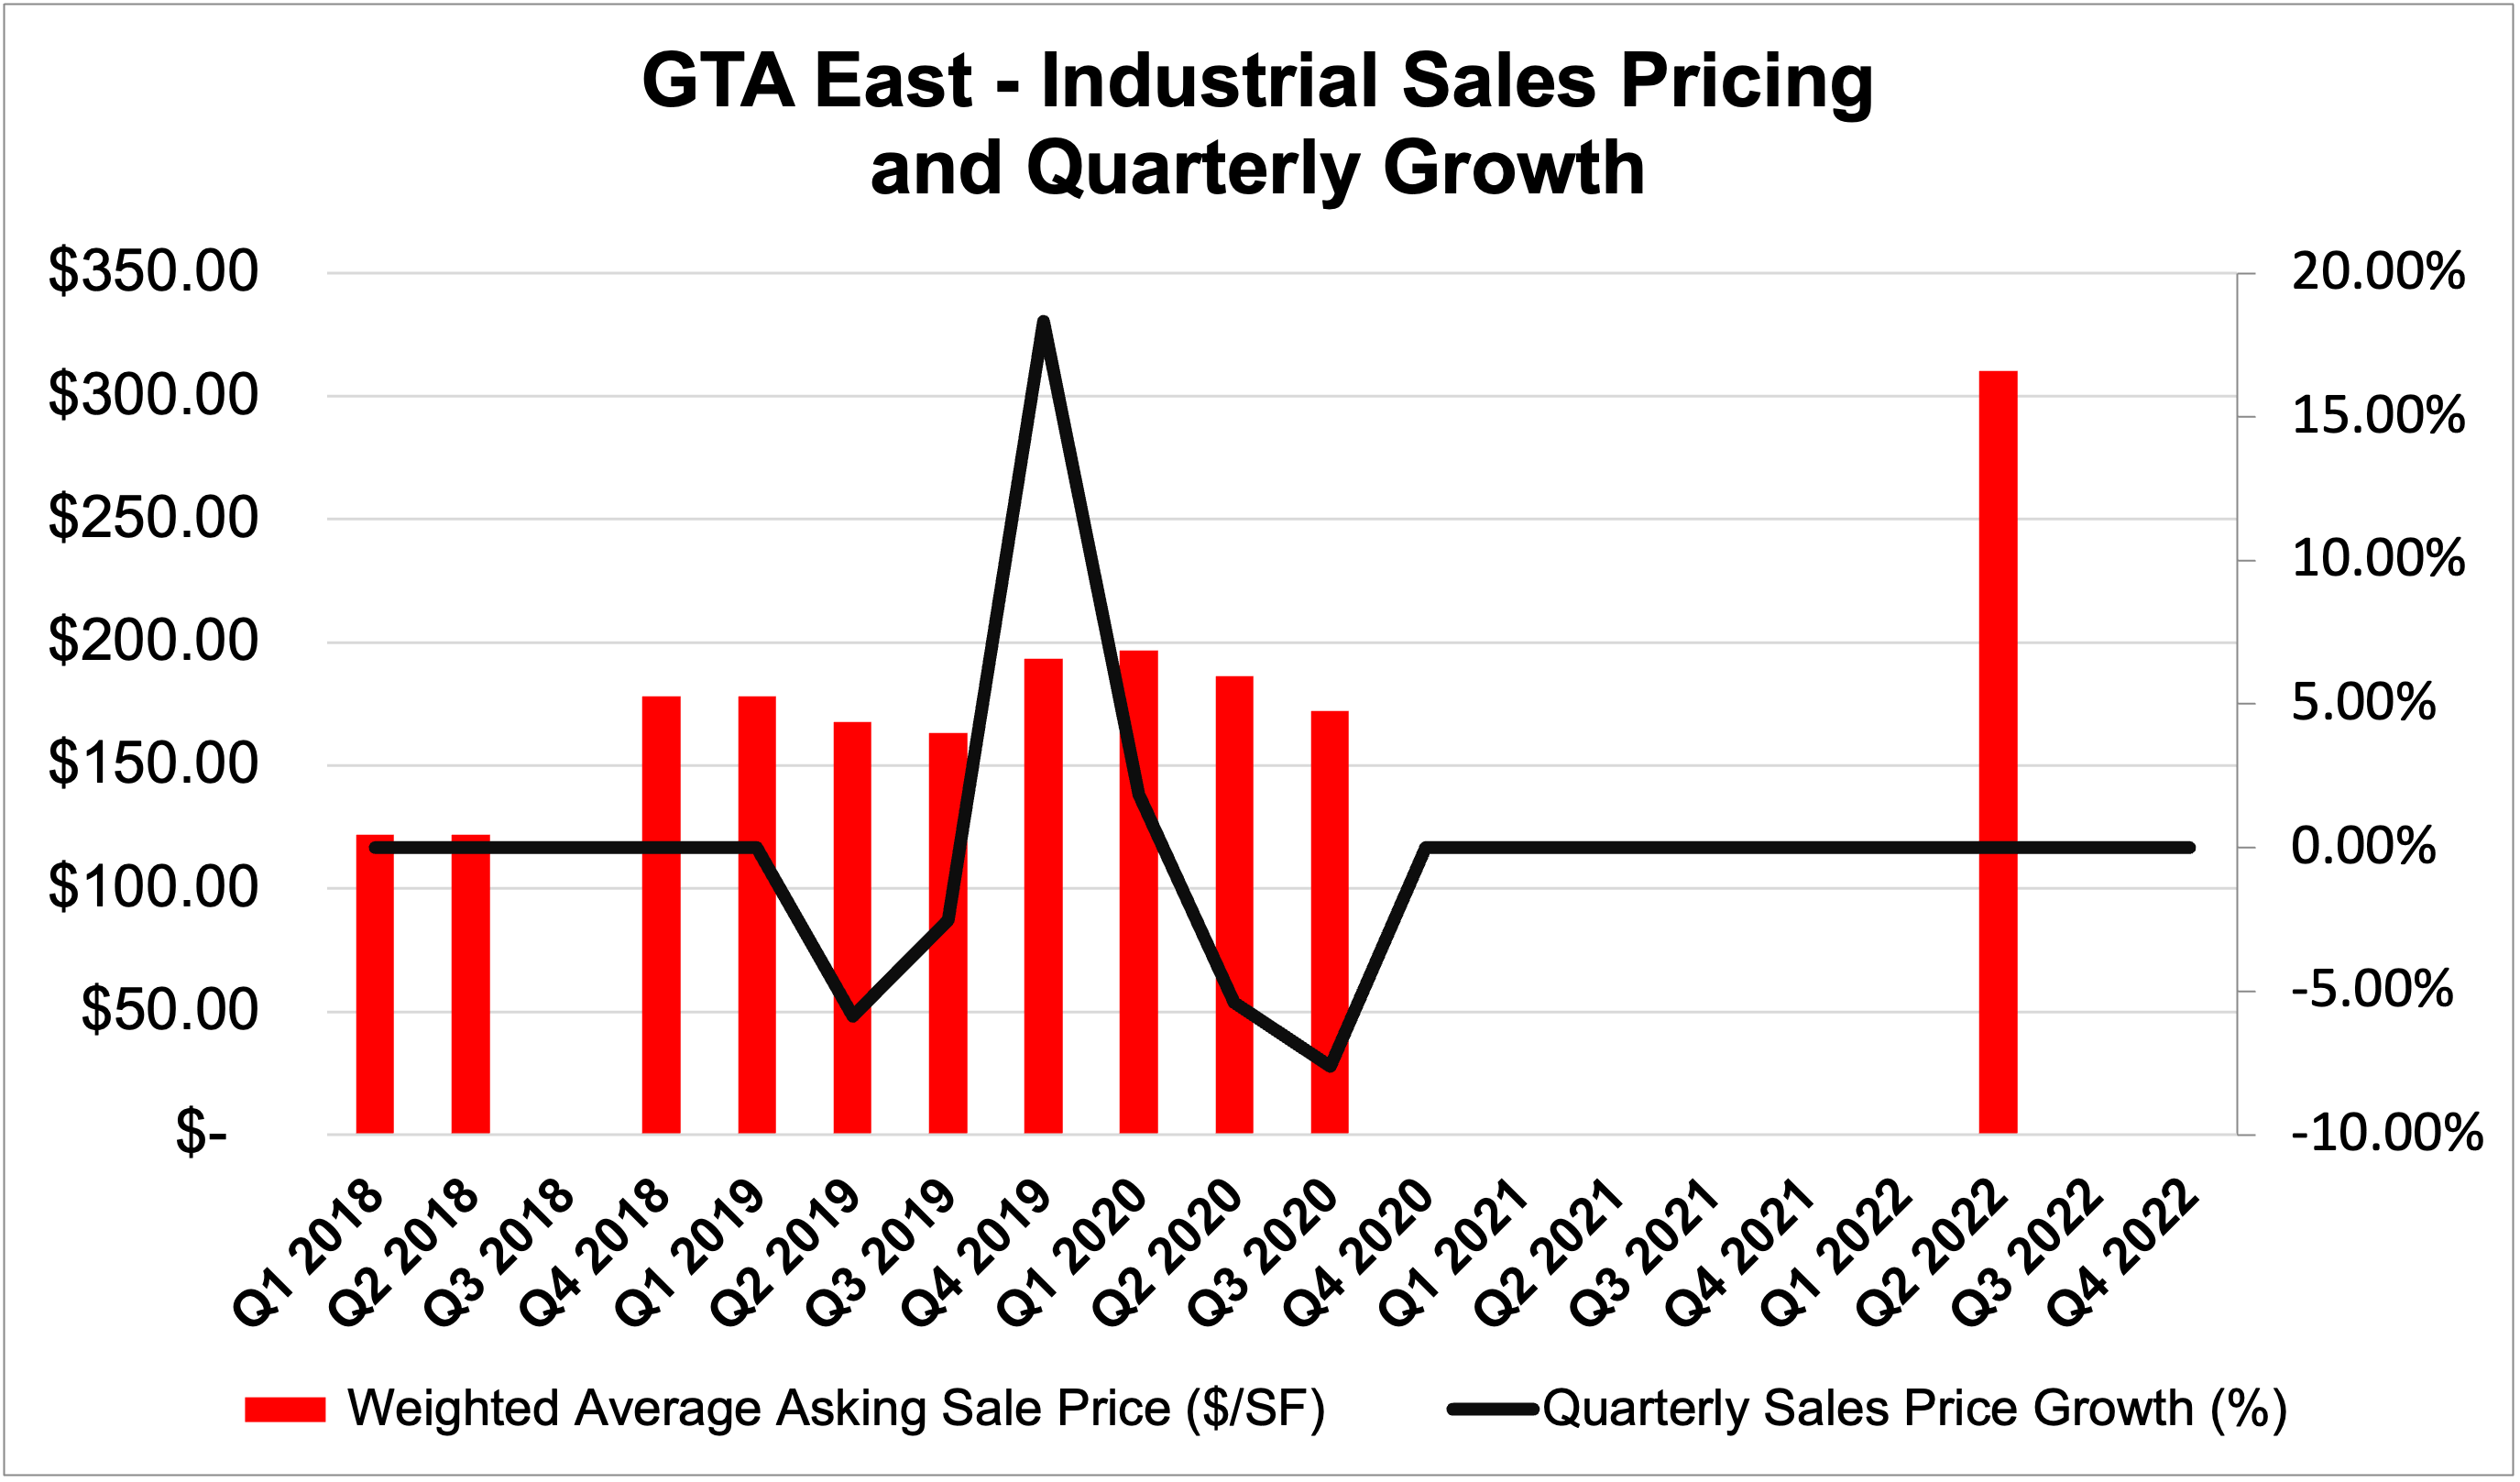
GTA East Industrial Sales Pricing and Growth, 2018 to 2022. Source: Cushman & Wakefield.
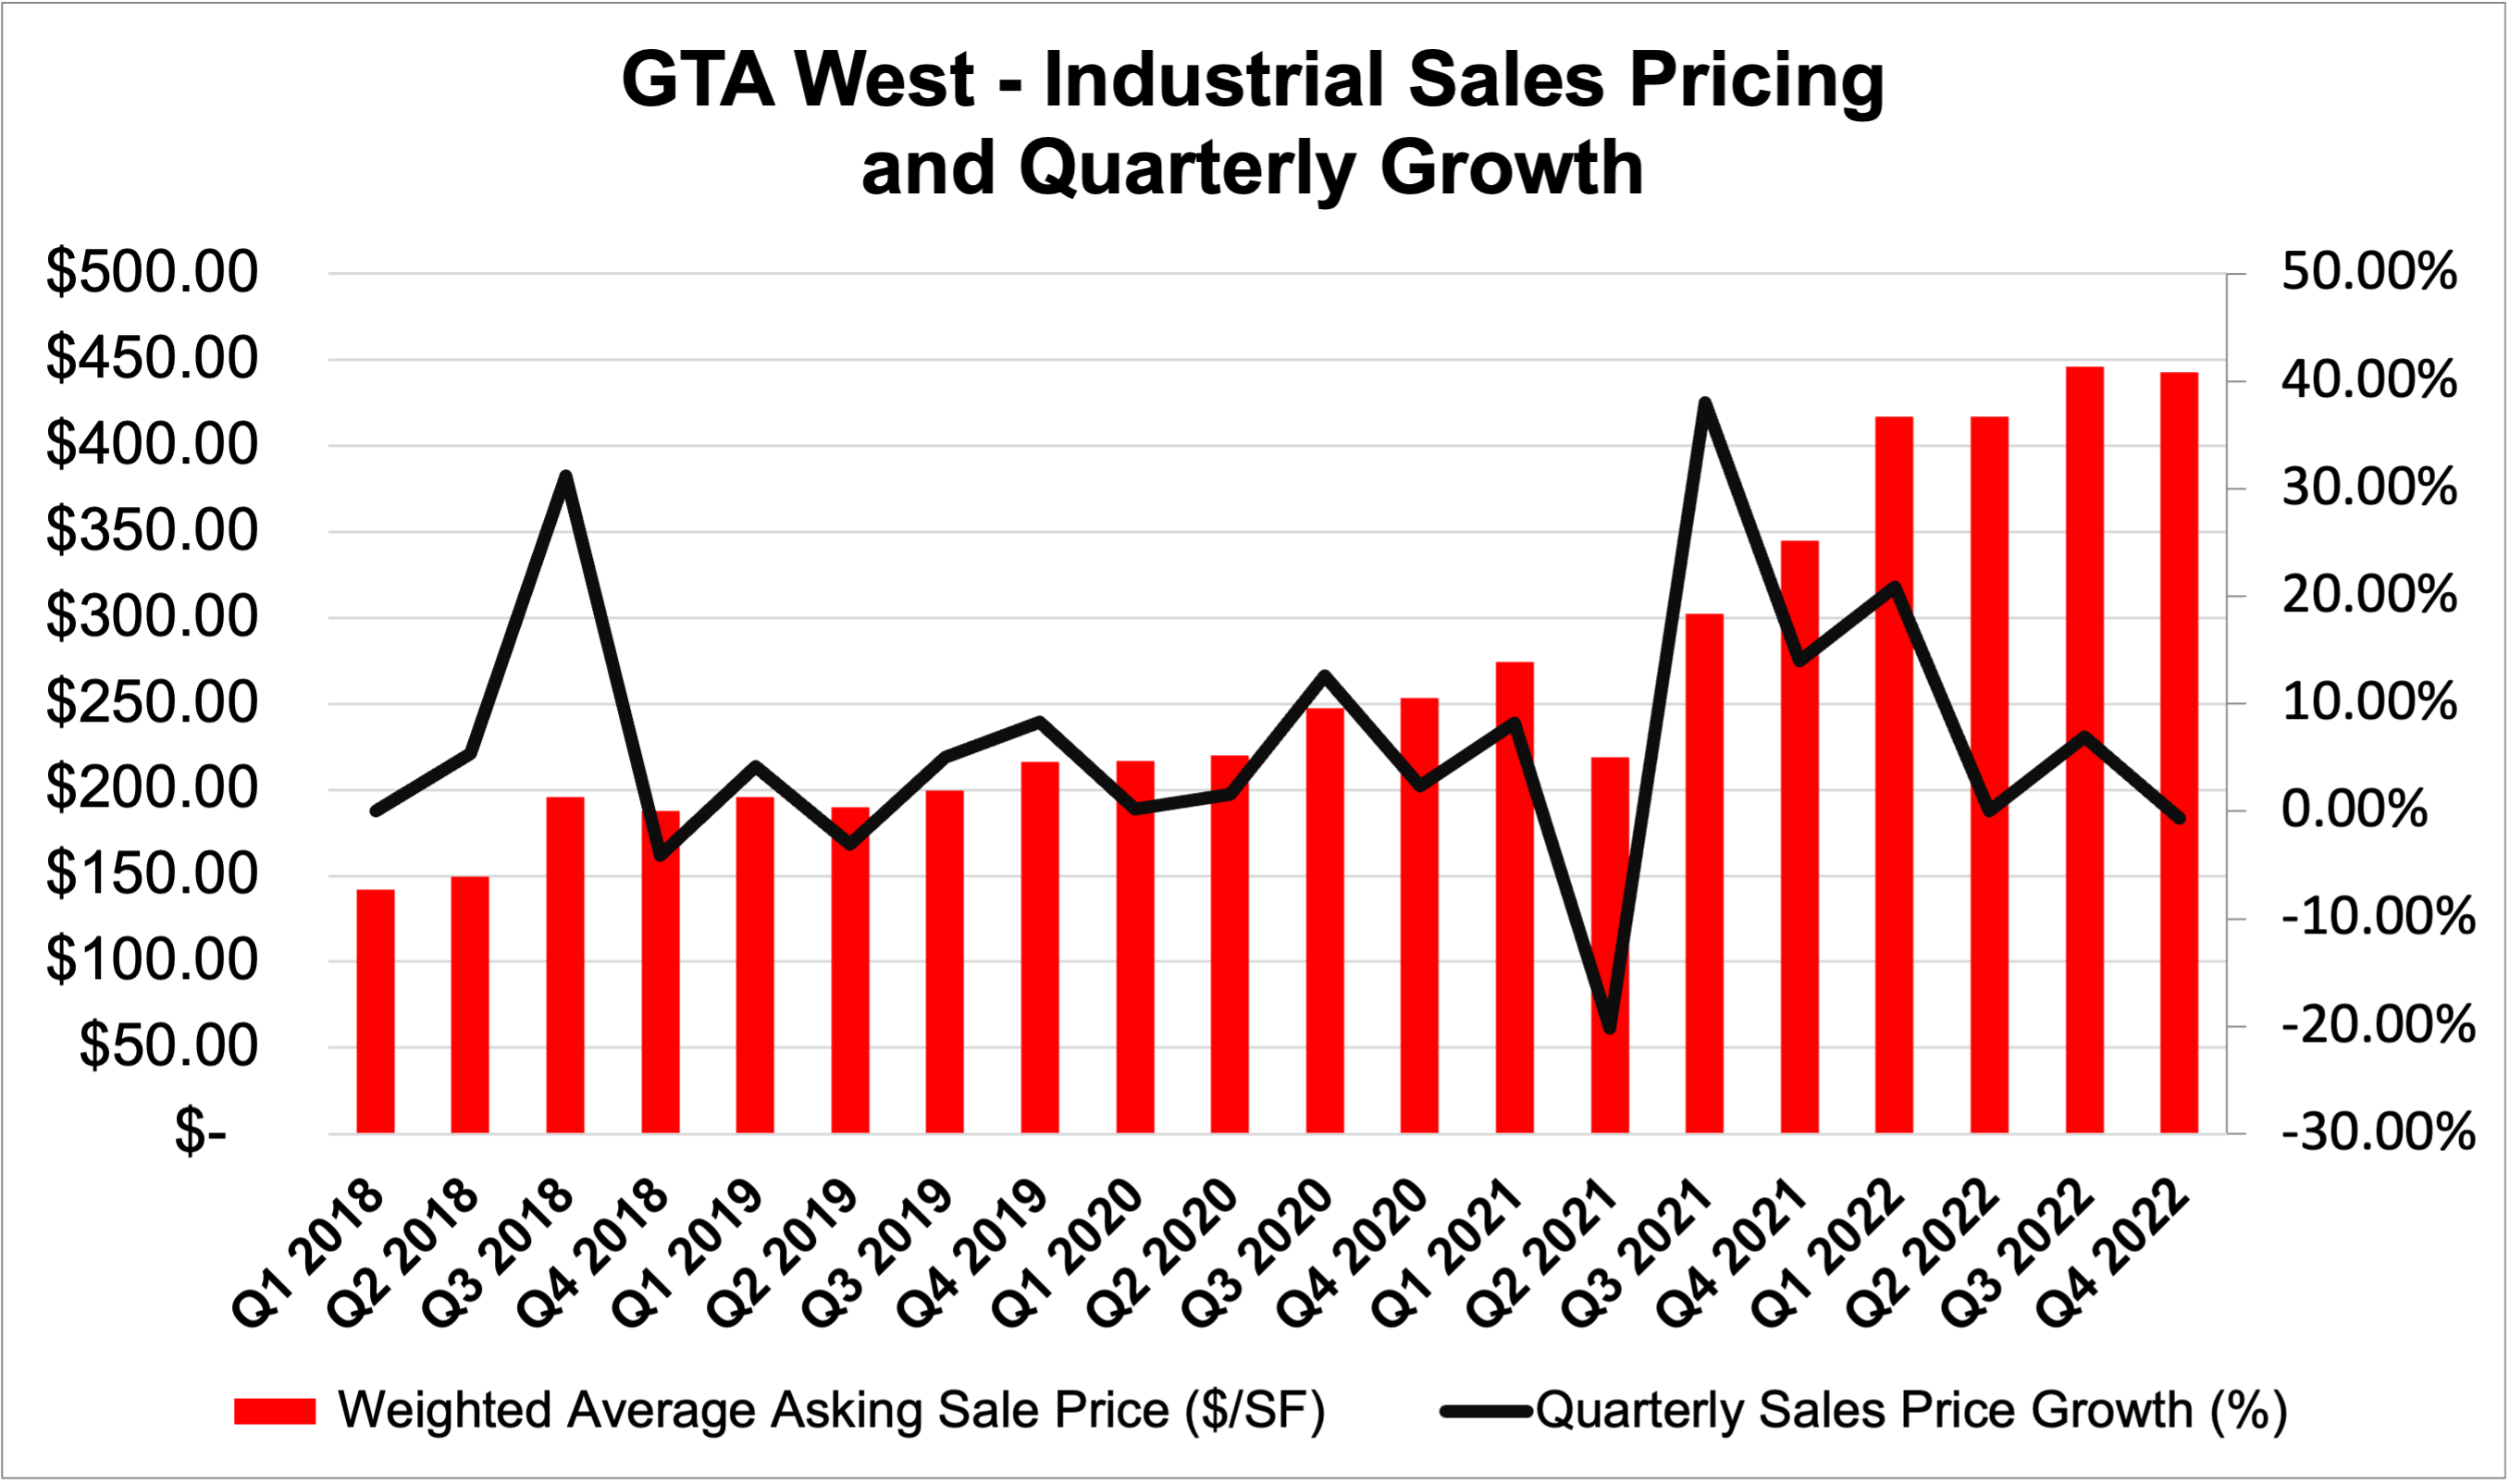
GTA West Industrial Sales Pricing and Growth, 2018 to 2022. Source: Cushman & Wakefield.
Major Industrial Transactions
- Summit REIT Portfolio Sale to Dream/GIC
155 Orenda Road, Brampton. Source: Altus Group.
Pictured above: 155 Orenda Road was part of the Summit REIT portfolio acquired by Dream/GIC and the 376,132 SF industrial facility was purchased for $125,000,000, or $332.33 PSF. Previously, in March 2013, the property was acquired by Summit REIT for $27,890,000, or $74 PSF; representing a 4.48 times increase in value, or approximately 47% annual return over 9.5 years.
November 2022 – Through a joint venture, Dream Industrial REIT and Singapore-based GIC have acquired Summit Industrial Income REIT for $23.50 per share, or $5.9 billion in cash, representing a 31% premium on last closing price.
The acquisition, whereby Dream secured a 10% stake (with GIC retaining the other 90%), made waves throughout the Greater Toronto commercial real estate community.
According their Q3 reports, Summit owns or has a stake in 162 properties totalling 21.8 MSF, with $3.5 billion of unencumbered assets, a 99.6% occupancy rate with an average lease term of 5.5 years, and 14 buildings under development aggregating 2.5 MSF of potential GLA. Revenues from investment properties totalled $63.048 M in Q3 2022.
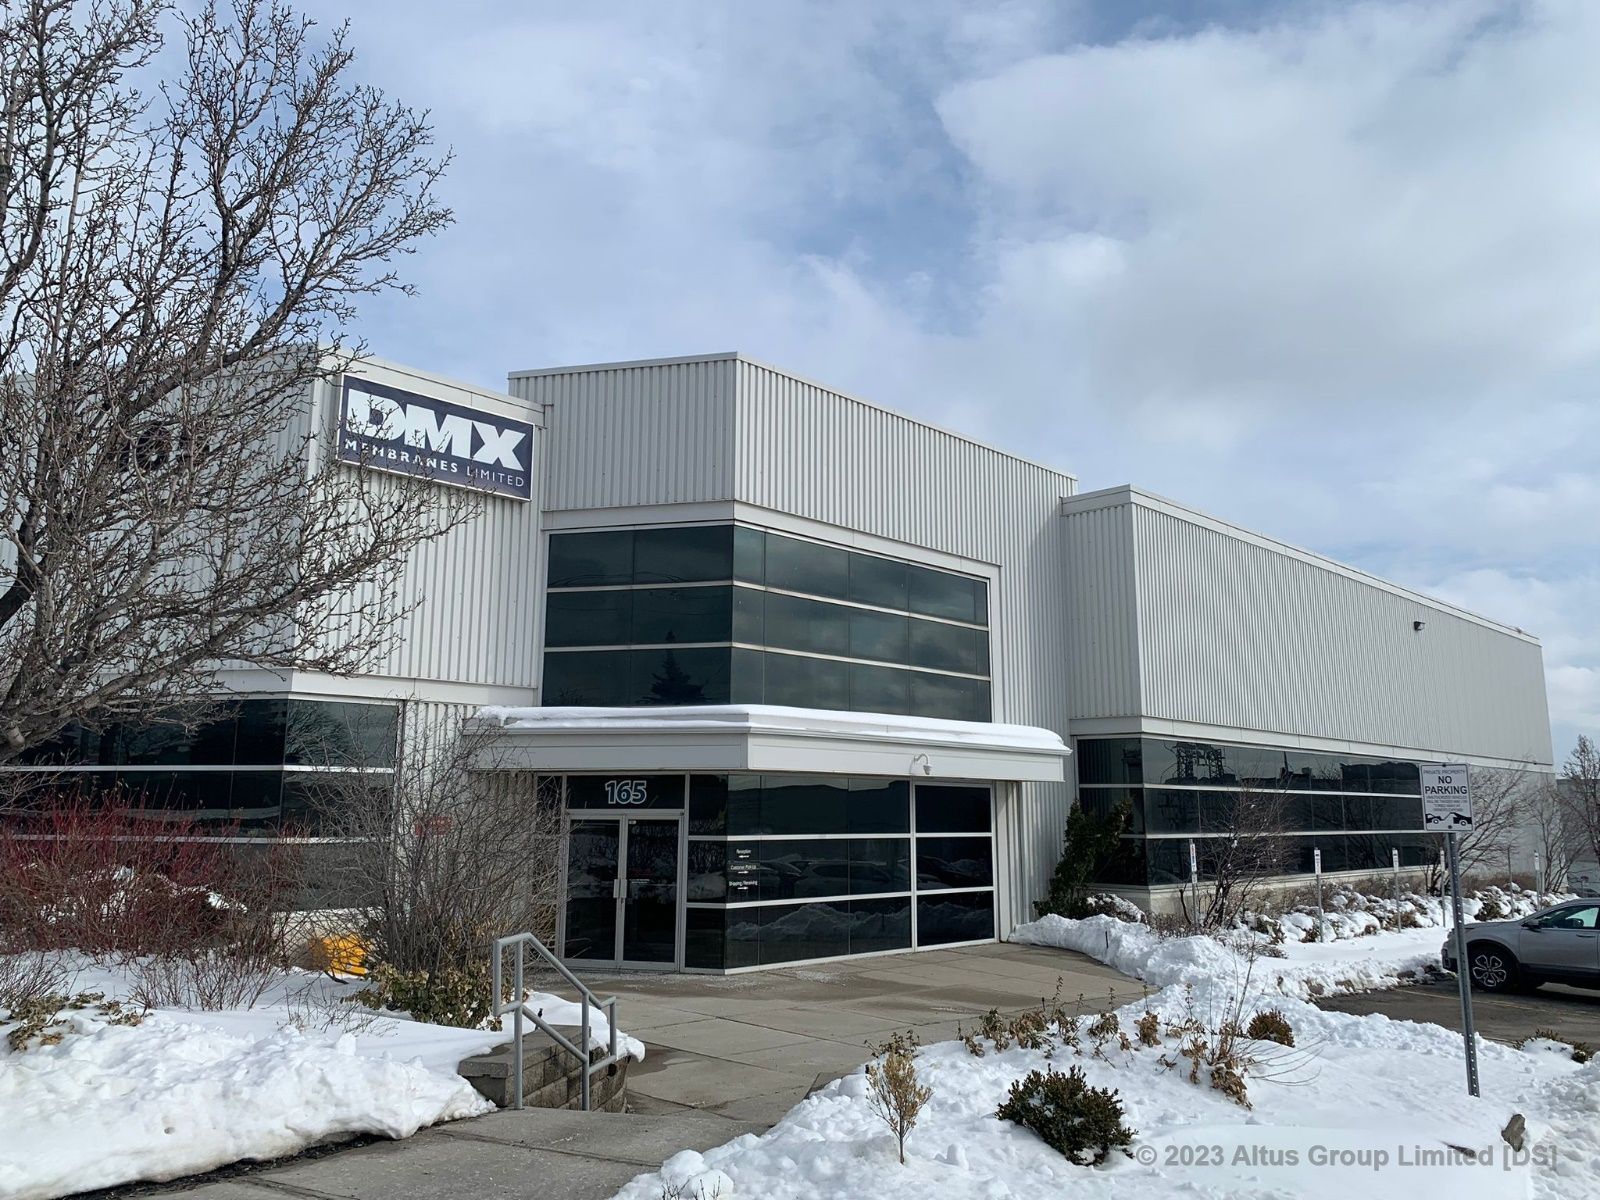
- 1330 Martin Grove Road – Carterra Sale to Vestcor for $139.5M
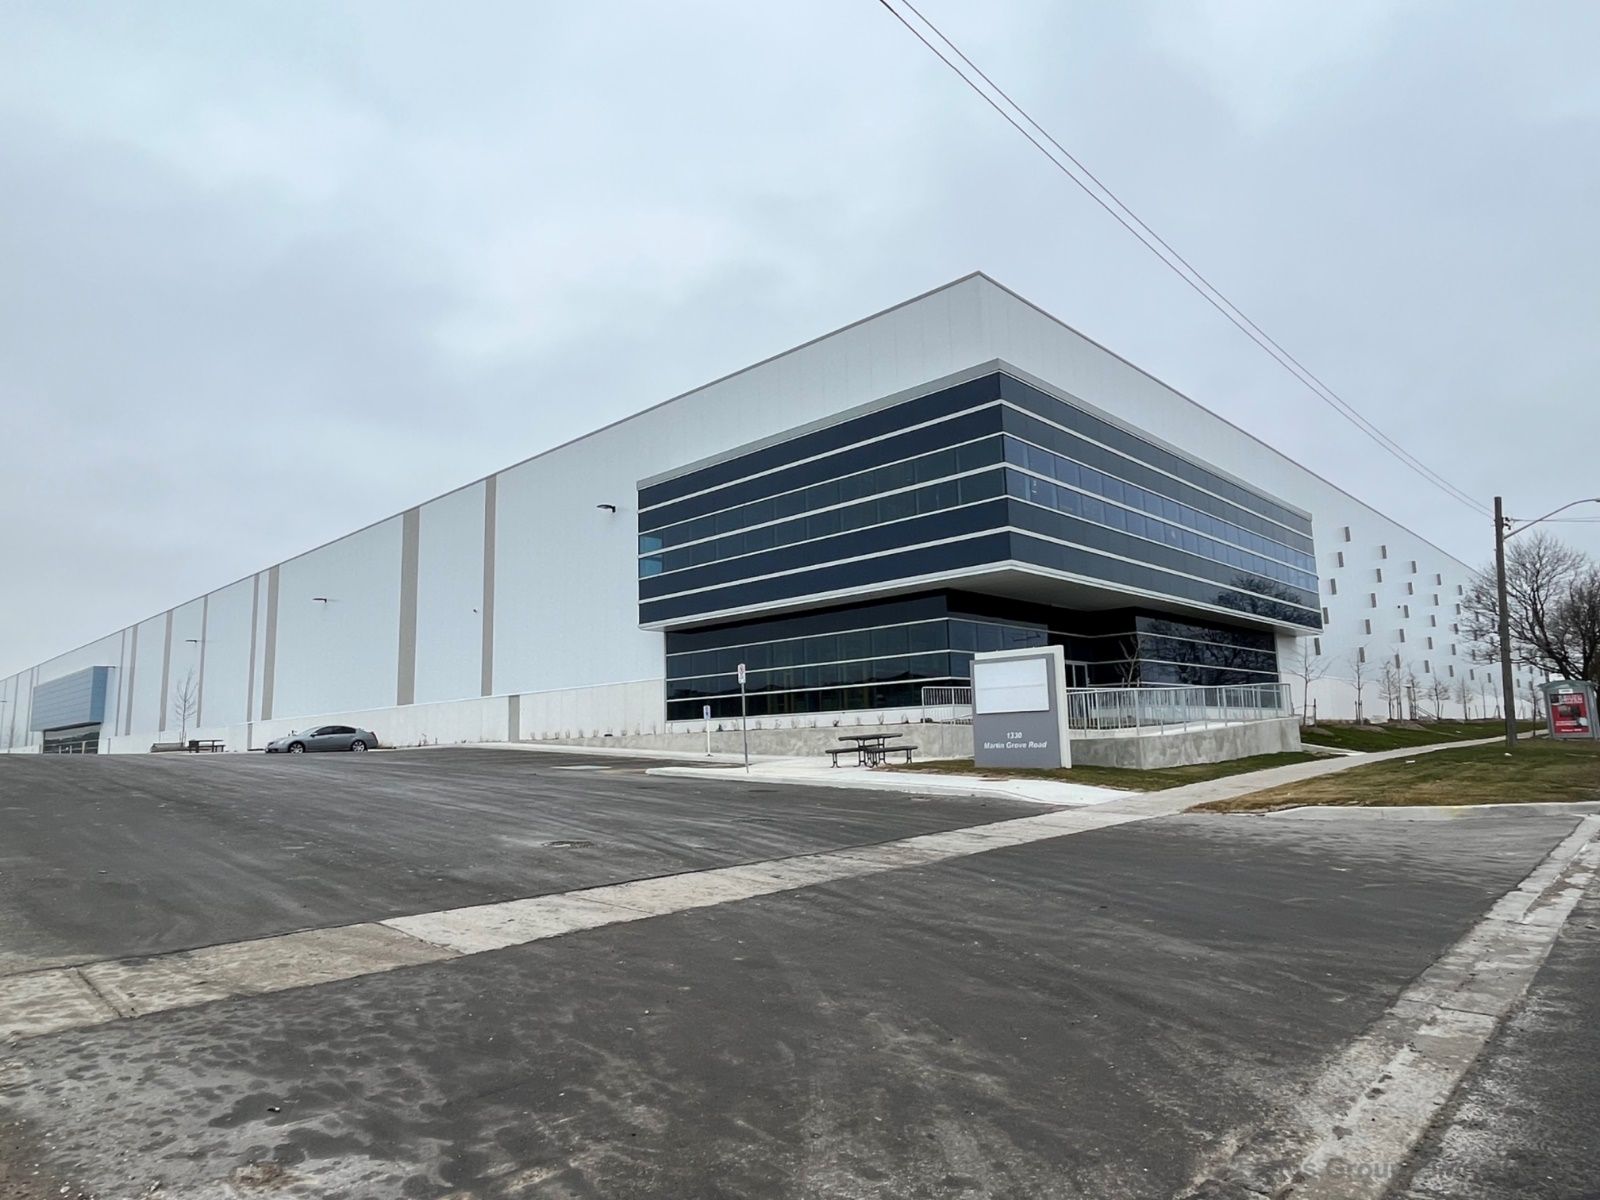
1330 Martin Grove Road, Etobicoke.
Vestcor acquired the 368,632 SF industrial property at 1330 Martin Grove Road from Carterra for $139.5 million in December 2022, representing a per-square-foot price of $378.
The 14.1-acre site was acquired by Carterra in October 2017 for $19,375,000 and was redeveloped with a new speculative industrial facility completed in May 2022 and reportedly occupied by Brimich Logistics in October 2022. As you can see, even taking development costs into consideration, there was a sizeable lift in value in just over 5 years.
Conclusion:
Looking ahead, the industrial market continues to defy the broader economic uncertainty by remaining highly sought-after. Rising interest rates, insolvent banks, and a myriad of other macro concerns have not put a dent in industrial values yet.
As is with common sense, it may certainly be more challenging or rigorous to complete a deal, obtain financing, go through development, or even secure a tenant. That said, if you currently own a well-maintained and -located industrial property within the GTA, there are still large institutional and private investors with dry powder seeking to obtain these assets, both for their strong cashflows and as a hedge against inflation and any potential threats to the financial system.
If selling your property is still something you would consider but have not followed through with for any reason, it is not too late to do so… just ensure that you go into any sales process with a clear strategy and expectations, as well as an understanding of potential outcomes.
For a confidential consultation or a complimentary opinion of value of your property please give us a call.
Until next week…
Goran Brelih and his team have been servicing Investors and Occupiers of Industrial properties in Toronto Central and Toronto North markets for the past 30 years.
Goran Brelih is an Executive Vice President for Cushman & Wakefield ULC in the Greater Toronto Area.
Over the past 30 years, he has been involved in the lease or sale of approximately 25.7 million square feet of industrial space, valued in excess of $1.6 billion dollars while averaging between 40 and 50 transactions per year and achieving the highest level of sales, from the President’s Round Table to Top Ten in GTA and the National Top Ten.
Specialties:
Industrial Real Estate Sales and Leasing, Investment Sales, Design-Build and Land Development
About Cushman & Wakefield ULC.
Cushman & Wakefield (NYSE: CWK) is a leading global real estate services firm that delivers exceptional value for real estate occupiers and owners. Cushman & Wakefield is among the largest real estate services firms with approximately 53,000 employees in 400 offices and 60 countries.
In 2020, the firm had revenue of $7.8 billion across core services of property, facilities and project management, leasing, capital markets, valuation and other services. To learn more, visit www.cushmanwakefield.com.
For more information on GTA Industrial Real Estate Market or to discuss how they can assist you with your real estate needs please contact Goran at 416-756-5456, email at goran.brelih@cushwake.com, or visit www.goranbrelih.com.
Connect with Me Here! – Goran Brelih’s Linkedin Profile: https://ca.linkedin.com/in/goranbrelih
Goran Brelih, SIOR
Executive Vice President, Broker
Cushman & Wakefield ULC, Brokerage.
www.cushmanwakefield.com
Office: 416-756-5456
Mobile: 416-458-4264
Mail: goran.brelih@cushwake.com
Website: www.goranbrelih.com