
Current and Historical Analysis of Industrial Land Sales – GTA Central
October 8th, 2021
“To ask the right question is already half the solution of a problem.”
- Carl Jung
When looking for a solution, many experts tend to focus on data, data, data. However, the pairing of a question with empirical data cannot provide a reliable answer when the observer’s mind has already been focused.
Put simply, the question we pose in our mind directs us to collect the information we think we want.
This means our pursuit of truth is not a reflection of reality, but rather, of ourselves.
In differential equations, this is referred to as ‘initial conditions.’ Once established, this set of parameters naturally plays out given their programming; it not being a recording of the environment as it was before we interfered. Therefore, the observer must be careful not to limit or constrain the data, and must look at it through various perspectives to mitigate skew and bias.
Philosophical musings aside, all of this means we must ask better questions. Because, when we do, we can untangle the web of causality and better understand what is really at the root of it all.
As a follow-up to our 2-part look at GTA infrastructure projects and their impact on industrial land, we are kicking off a series whereby we will examine the historical patterns of industrial land values across the major GTA submarkets.
So without further ado, let’s get going.
Methodology
For our analysis, we looked at the sale of industrial, commercial, and institutional land. We ignored agricultural, infrastructure, retail, office, golf course, and conservation land sales. Further, we excluded non-arms length sales, as well as transactions under $100,000 per acre, or those a few standard deviations higher than the median value. Trimming the outliers on either end helped to remove the skew and give a more accurate picture.
Limitations
As a result of this exercise, we naturally reduced our sample size, meaning that data is incomplete for certain submarkets during certain quarters. This is expected, as industrial land does not trade as frequently as industrial properties.
In order to improve the statistical significance, we looked at the Regional data (i.e. GTA Central, North, East, or West markets) together. This greatly smoothed the data, however, it results in a value that depicts an average parcel of land in an average submarket.
For example, while the average value of industrial land in GTA North in 2016 may have been $641,959.75 per acre… we would certainly expect a prime, well-located, serviced parcel in Vaughan to go for 2 or 3 times that price (keep in mind we are talking about 2016).
So with that said, you will need to take the following data with a grain of salt and apply discernment in order to parse out what would be reasonable given a multitude of factors when valuing a commercial asset.
GTA Historical Industrial Land Sales Volume Breakdown – Q1 2016 to Q3 2021
As we see in Figure 1, transaction volume for GTA industrial land has steadily increased from 2016 through to 2021, with a clear dip in 2020.
However, this year, we have seen sales volume break away in an upward trajectory. This should come as no surprise as both developers and occupiers look to construct industrial facilities in a market with record-low availabilities. This has translated into an increase in per-acre pricing and the number of completed transactions.
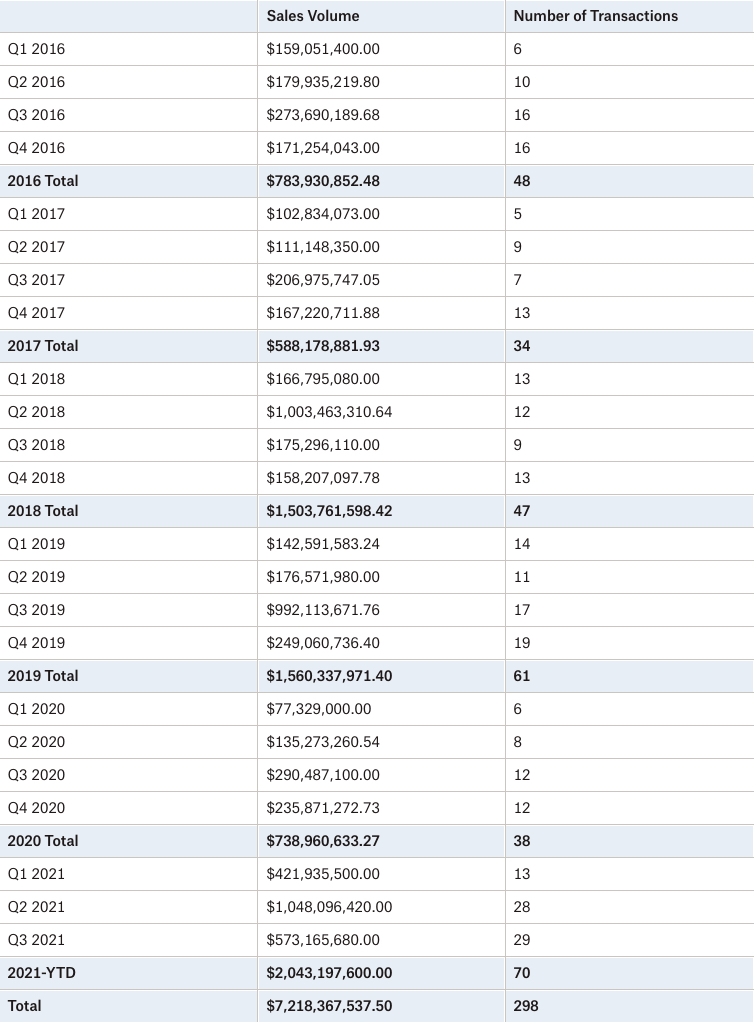
Figure 1 – GTA Historical Sales Volume Breakdown – Q1 2016 to Q2 2021. Source: RealNet.
Looking closely at the quarterly activity in Figure 2, we see a steady upward trend over the period of Q1 2016 to Q3 2021. This pattern includes a clear crash in volume and transactions in Q1 2020, as well as the subsequent recovery into 2021. To note: spikes in sales volume can be largely attributed to blockbuster deals where either massive tracts of land or extremely sought-after and well-located parcels were sold to developers.

Figure 2 – GTA Historical Quarterly Industrial Land Sales Volume – Q1 2016 to Q2 2021. Source: RealNet.
Now, if we look at Figure 3, we see a more smoothed trendline of the data depicted above. Overall, we notice an almost perfect co-movement and correlation in sales volume and the number of transactions; with the 2020 dip and 2021 recovery clearly visible.

Figure 3 – GTA Historical Yearly Industrial Land Sales Volume – 2016 to 2021-YTD. Source: RealNet.
Greater Toronto Central Markets (North York, Etobicoke, Scarborough)
Next, looking at Figures 4 and 5, we can observe the difference between the GTA-Central markets compared to the broader GTA market.
Sales volumes have fluctuated due largely to the scarcity of industrial land. As mentioned earlier, large deals tend to skew volume upwards, while the relatively few number of transactions makes it challenging to establish clear valuations on land pricing per acre; which can be affected by many factors, including: location, servicing, and zoning.
That being said, we do see a clear increase in the pricing to a staggering $4.2 million per acre in 2021. As we have alluded to, this does not mean that every parcel will achieve such a price. Extremely sought-after locations in more desirable submarkets may be worth more, while less attractive tracts of land would obviously be worth less.

Figure 4 – GTA Central – Historical Yearly Industrial Land Sales Activity – 2016 to 2021-YTD. Source: RealNet.
Figure 5 – GTA Central – Historical Yearly Industrial Land Sales Volume – 2016 to 2021-YTD. Source: RealNet.
Ten Major Land/Infill Transactions in GTA Central – 2016 to 2021-YTD

Figure 6 – 2016 to Year-to-Date 2021 – Ten Major Land/Infill Transactions – GTA Central. Source: RealNet.
Conclusion
After looking through the data, we hope you can not only begin to see some of the broader patterns but perhaps also create hypotheses as to why things may have played out the way they did. We also hope you can also begin to make soft predictions about where values and the market is headed.
Our thoughts are this:
- Industrial is being fuelled by E-commerce demand, as well as other verticals such as online grocery sales, transportation, and even film production;
- Investors are keen to deploy capital, often willing to pay a premium, further pushing up values;
- Supply chain disruptions are causing many businesses to on-shore their operations, adding to demand;
- Land is scarce, period;
- The pandemic has created delays in the permitting, servicing, and zoning processes.
- ALL of these factors – including demand and scarce supply – are translating into a frenzy to secure desirable plots of industrial land on which to develop much-needed industrial facilities.
Key Takeaways
For investors: Those who ‘land-banked’ in the past are now reaping the rewards, as is exampled by the recent $165M land sale in Milton where a group of investors purchased the asset for $15M in 2016. Finding deals now is more difficult, and the lack of available industrial space, coupled with the scarcity of industrial land, is creating a competitive buying environment. This will result in a further increase in the price of quality industrial land.
For Occupiers: While most occupiers tend to focus on leasing existing or soon-to-be completed space, there is a noticeable trend in early pre-leasing, as well as JVs with developers to construct design-builds. This means that Occupiers may expect to become more involved in the development process, and should therefore understand land values, as it will directly impact the cost to construct, and therefore, rents. Either way, more costly land means higher values and rental rates once those facilities are constructed. The real concern remains securing the space ahead of your competitors.
Overall, prepare to pay more. Introduce more time into your pursuits of deals. And be prepared to build (two years or more in advance) or complete an early renewal (18 to 24 months out) if you want to stay at your current location.
Finally, for a confidential consultation or a complimentary opinion of value of your property please give us a call.
Until next week…
Goran Brelih and his team have been servicing Investors and Occupiers of Industrial properties in Toronto Central and Toronto North markets for the past 29 years.
Goran Brelih is a Senior Vice President for Cushman & Wakefield ULC in the Greater Toronto Area.
Over the past 29 years, he has been involved in the lease or sale of approximately 25.7 million square feet of industrial space, valued in excess of $1.6 billion dollars while averaging between 40 and 50 transactions per year and achieving the highest level of sales, from the President’s Round Table to Top Ten in GTA and the National Top Ten.
Specialties:
Industrial Real Estate Sales and Leasing, Investment Sales, Design-Build and Land Development
About Cushman & Wakefield ULC.
Cushman & Wakefield (NYSE: CWK) is a leading global real estate services firm that delivers exceptional value for real estate occupiers and owners. Cushman & Wakefield is among the largest real estate services firms with approximately 53,000 employees in 400 offices and 60 countries.
In 2020, the firm had revenue of $7.8 billion across core services of property, facilities and project management, leasing, capital markets, valuation and other services. To learn more, visit www.cushmanwakefield.com.
For more information on GTA Industrial Real Estate Market or to discuss how they can assist you with your real estate needs please contact Goran at 416-756-5456, email at goran.brelih@cushwake.com, or visit www.goranbrelih.com.
Connect with Me Here! – Goran Brelih’s Linkedin Profile: https://ca.linkedin.com/in/goranbrelih
Goran Brelih, SIOR
Senior Vice President, Broker
Cushman & Wakefield ULC, Brokerage.
www.cushmanwakefield.com
www.siorccc.org
Office: 416-756-5456
Mobile: 416-458-4264
Mail: goran.brelih@cushwake.com
Website: www.goranbrelih.com

Newsletter
Join our mailing list to receive the latest news and updates from our team.