
Historical Industrial Sales Volumes and Major Transactions in GTA North Markets
Understanding and Forecasting GTA Industrial Values
August 27th, 2021
Beating records is an inspiring – even addictive – phenomenon. The moment you have broken one, whether individually or collectively, there grows an urge to demonstrate to yourself or the market that you can do it again; if only to prove that it was not by chance.
When it comes to the Greater Toronto industrial market, however, the many investors, developers, and landlords purchasing properties and portfolios aren’t proactively looking to pay more to prove a point. If anything, they are trying to find, unlock, and create value so as to stabilize their assets more quickly; with greater margins, and with more predictability.
Why, therefore, have values and rental rates consistently climbed to new heights over the past several years?
Well, the broad stroke narrative is about the basic forces of supply and demand.
Looking granularly at the numbers, as we will in this newsletter, we can see the devastating effects of the economic shutdowns on deal volume. However, even for those submarkets still recovering, there appears to be a specific inflection point where the scales tipped into an imbalance that has created the market we currently live in.
Yes, there are many other factors at play, such as delays in the permitting process, material and labour shortages, and regulations stemming from the pandemic. And yes, the industrial asset class is itself being transformed and modernized by the e-commerce and logistics industry.
We find ourselves in a loop, if you will. An equilibrium within a set of differential equations whereby moving into a new balance would require a massive shock to either demand or supply, or both.
Until that time comes, we should expect the gravitational pull of space-hungry behemoths such as Amazon to anchor availabilities at near-zero levels; forcing values to continue creeping ever upward.
So without further ado, let us examine the historical sales volumes of the past five years, as well as the major year-to-date transactions, in order gain a better understanding of value within the Greater Toronto industrial market.
Greater Toronto North Markets (Vaughan, Markham, Richmond Hill, Aurora & Newmarket)
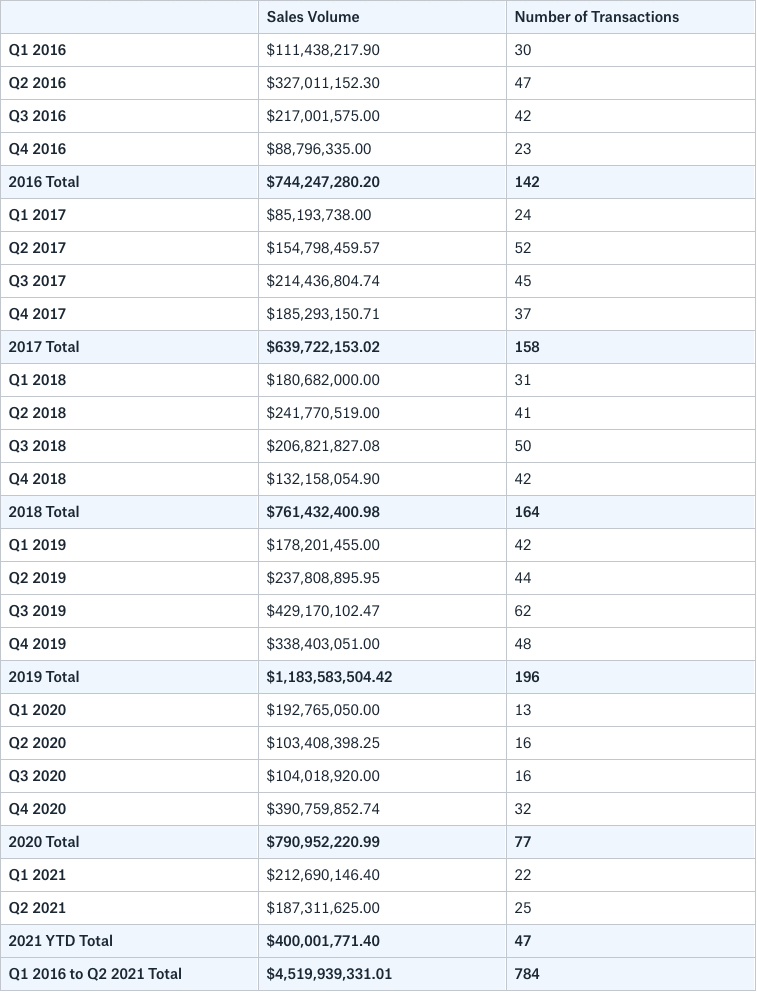
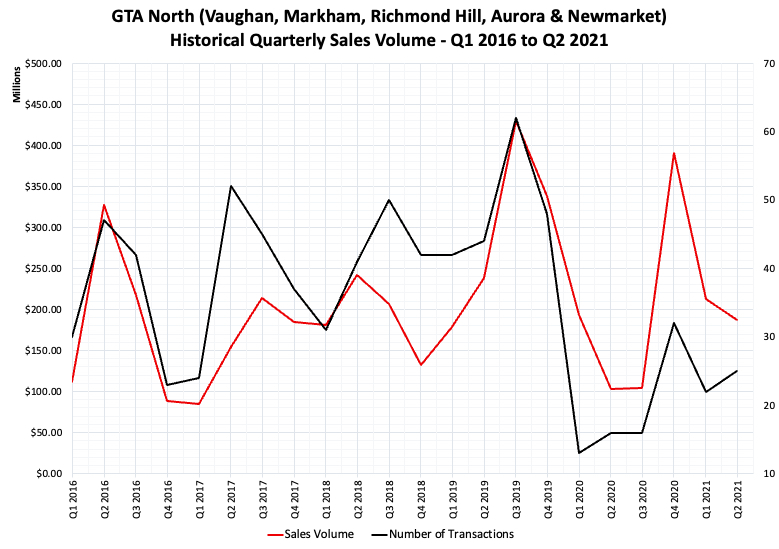
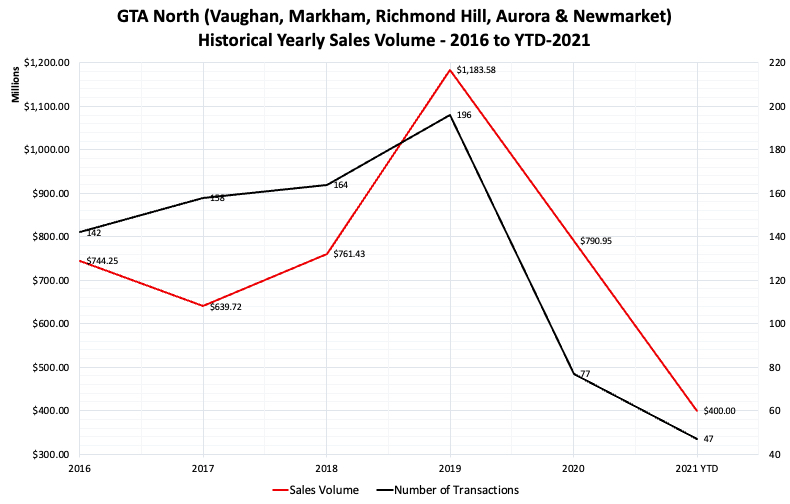
Historical Sales Volume Breakdown – Q1 2016 to Q2 2021
In stark contrast to the GTA Central markets, transaction volume in the GTA North markets took a huge hit in Q2 and Q3 2020, as would be expected during the pandemic. Sales volume in Q4 2020 spiked – making it the second most active quarter since Q1 2016; outmatched only by activity in Q3 2019. Year-to-date volume is in line with expectations, and the market seems poised to bounce back if it can match historical end-of-year numbers.
Given that these submarkets have some of the highest valuations per square foot in the region – and coupled with general demand for industrial – it would be unsurprising if this occurred. The only conceivable roadblock would be the overall near-zero availability for sale.
Year-to-Date 2021 – Top Ten Transactions in GTA North
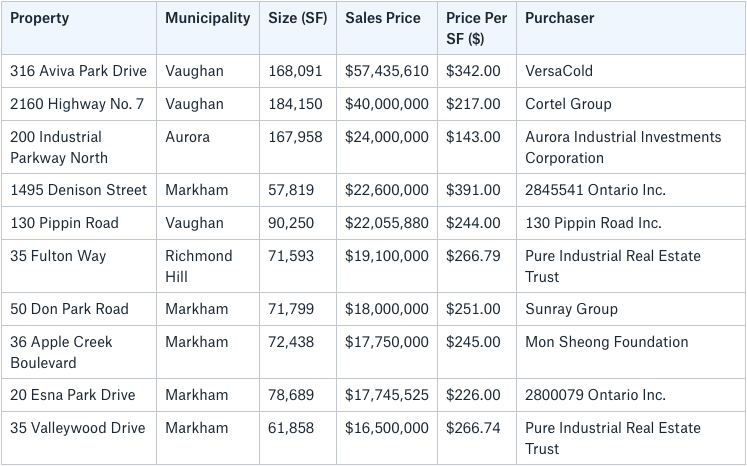
Figure 4 – Year-to-Date 2021 – Top Ten Transactions – GTA North. Source: RealNet.
130 Pippin Road, Vaughan
- industrial is definitively being fuelled by E-commerce demand, as well as other verticals such as online grocery sales, transportation, and even film production;
- investors are keen to deploy capital, often willing to pay a premium, further pushing up values and compressing cap rates;
- supply chain disruptions are causing many businesses to on-shore their operations, adding to demand;
- these disruptions are also causing businesses to increase inventories where possible, further bolstering need for space;
- land is scarce, as is available product;
- new supply is being hamstrung by labour and material shortages, as well as delayed permitting and zoning processes.
Key Takeaways
For Investors: Now that we seem to be caught in a supply trap, one should expect to see values increase further, albeit at a decelerating pace relative to the jump we saw over the past 5 years. Only future data will tell how much further values have to go… That being said, it’s very likely that cap rates will continue to compress and pricing will go up further.
For Occupiers: Similarly, one should expect further increases in pricing. If you want to lease, you’ll have to pay more. If you want to own, you’ll have to pay more. In addition, it will be more difficult to find opportunity and the deals may take more time to complete unless you are lucky or hit the timing perfectly. Further to this, if you cannot find anything, you may have to develop; only if you can find any land available to do so.
Overall, prepare to pay more. Introduce more time into your pursuits of deals. And be prepared to build (two years or more in advance) or complete an early renewal (18 to 24 months out) if you want to stay at your current location.
Finally, for a confidential consultation or a complimentary opinion of value of your property please give us a call.
Until next week…
Goran Brelih and his team have been servicing Investors and Occupiers of Industrial properties in Toronto Central and Toronto North markets for the past 29 years.
Goran Brelih is a Senior Vice President for Cushman & Wakefield ULC in the Greater Toronto Area.
Over the past 29 years, he has been involved in the lease or sale of approximately 25.7 million square feet of industrial space, valued in excess of $1.6 billion dollars while averaging between 40 and 50 transactions per year and achieving the highest level of sales, from the President’s Round Table to Top Ten in GTA and the National Top Ten.
Specialties:
Industrial Real Estate Sales and Leasing, Investment Sales, Design-Build and Land Development
About Cushman & Wakefield ULC.
Cushman & Wakefield (NYSE: CWK) is a leading global real estate services firm that delivers exceptional value for real estate occupiers and owners. Cushman & Wakefield is among the largest real estate services firms with approximately 53,000 employees in 400 offices and 60 countries.
In 2020, the firm had revenue of $7.8 billion across core services of property, facilities and project management, leasing, capital markets, valuation and other services. To learn more, visit www.cushmanwakefield.com.
For more information on GTA Industrial Real Estate Market or to discuss how they can assist you with your real estate needs please contact Goran at 416-756-5456, email at goran.brelih@cushwake.com, or visit www.goranbrelih.com.
Connect with Me Here! – Goran Brelih’s Linkedin Profile: https://ca.linkedin.com/in/goranbrelih
Goran Brelih, SIOR
Senior Vice President, Broker
Cushman & Wakefield ULC, Brokerage.
www.cushmanwakefield.com
www.siorccc.org
Office: 416-756-5456
Mobile: 416-458-4264
Mail: goran.brelih@cushwake.com
Website: www.goranbrelih.com