When industry insiders network and discuss what they are seeing in the market, it is easy to get caught up in the narrative and repeat back generalized statements – because that’s what everyone believes to be true.
What starts out as a simple cause-effect observation turns into a prediction, which evolves into either a forward-looking statement or self-fulfilling prophecy.
However, it is important to continually track and analyze the data to see if what we thought would happen, actually happens. Conclusions drawn are simply conclusions at that point in time, based on the data available.
Therefore, when the data changes, our perspective should change as well.
And not to mention, it’s always a good habit to confirm our theses, as well as to examine why things may not have played out as they were supposed to – whether as a result of our own biases, improperly made assumptions, or lack of context and experience.
For instance, and reflecting on our previous newsletter, many investors and occupiers have grown cautious as a result of rapidly rising interest rates. This cause-effect relationship between borrowing costs and purchase activity is textbook 101.
That said, did it really happen in real life? And if so, was it purely because of this phenomenon, or because of other variables? And since the initial shock, did markets and players adjust? Or are they still trying to rework their underwriting and pricing models?
That is why, today, we will dive deeper into some of the industrial sales trends and transactions in the GTA North and West markets in 2022.
GTA 2022 Industrial Sales Analysis – North & West Markets
The charts below show the industrial sales activity in the GTA North and West markets, with a focus on the building size in square feet, the sales price per square foot, and the sales price linear trend.
As we notice below, the GTA West markets were much more active than their Northern counterparts. Further, the West markets saw a considerably higher volume of larger, pricier trades occur, as well as a flurry of small- to mid-bay property transactions.

GTA North – 2022 Industrial Sales Analysis. Source: RealNet.
GTA North Market Industrial Sales
- Average Size: 42,434 SF
- Average Sale Price: $12,195,847
- Average Price PSF: $351.16
The North linear trend shows a steady increase from the mid- to upper-300s price PSF, while the West trendline shows a slightly steeper appreciation from the upper-300s to lower-400s price PSF.
These values are lower than what our general research shows, however, this could be due to the volume of small- and mid-bay acquisitions, the movement of older inventory, large portfolio sales, and redevelopment sites.
The fact is, for newer, high-ceiling industrial properties, based on rent potential, replacement costs, and general comparable sales, we would expect pricing to be in the low- to mid-400s price PSF, depending on the asset and location.
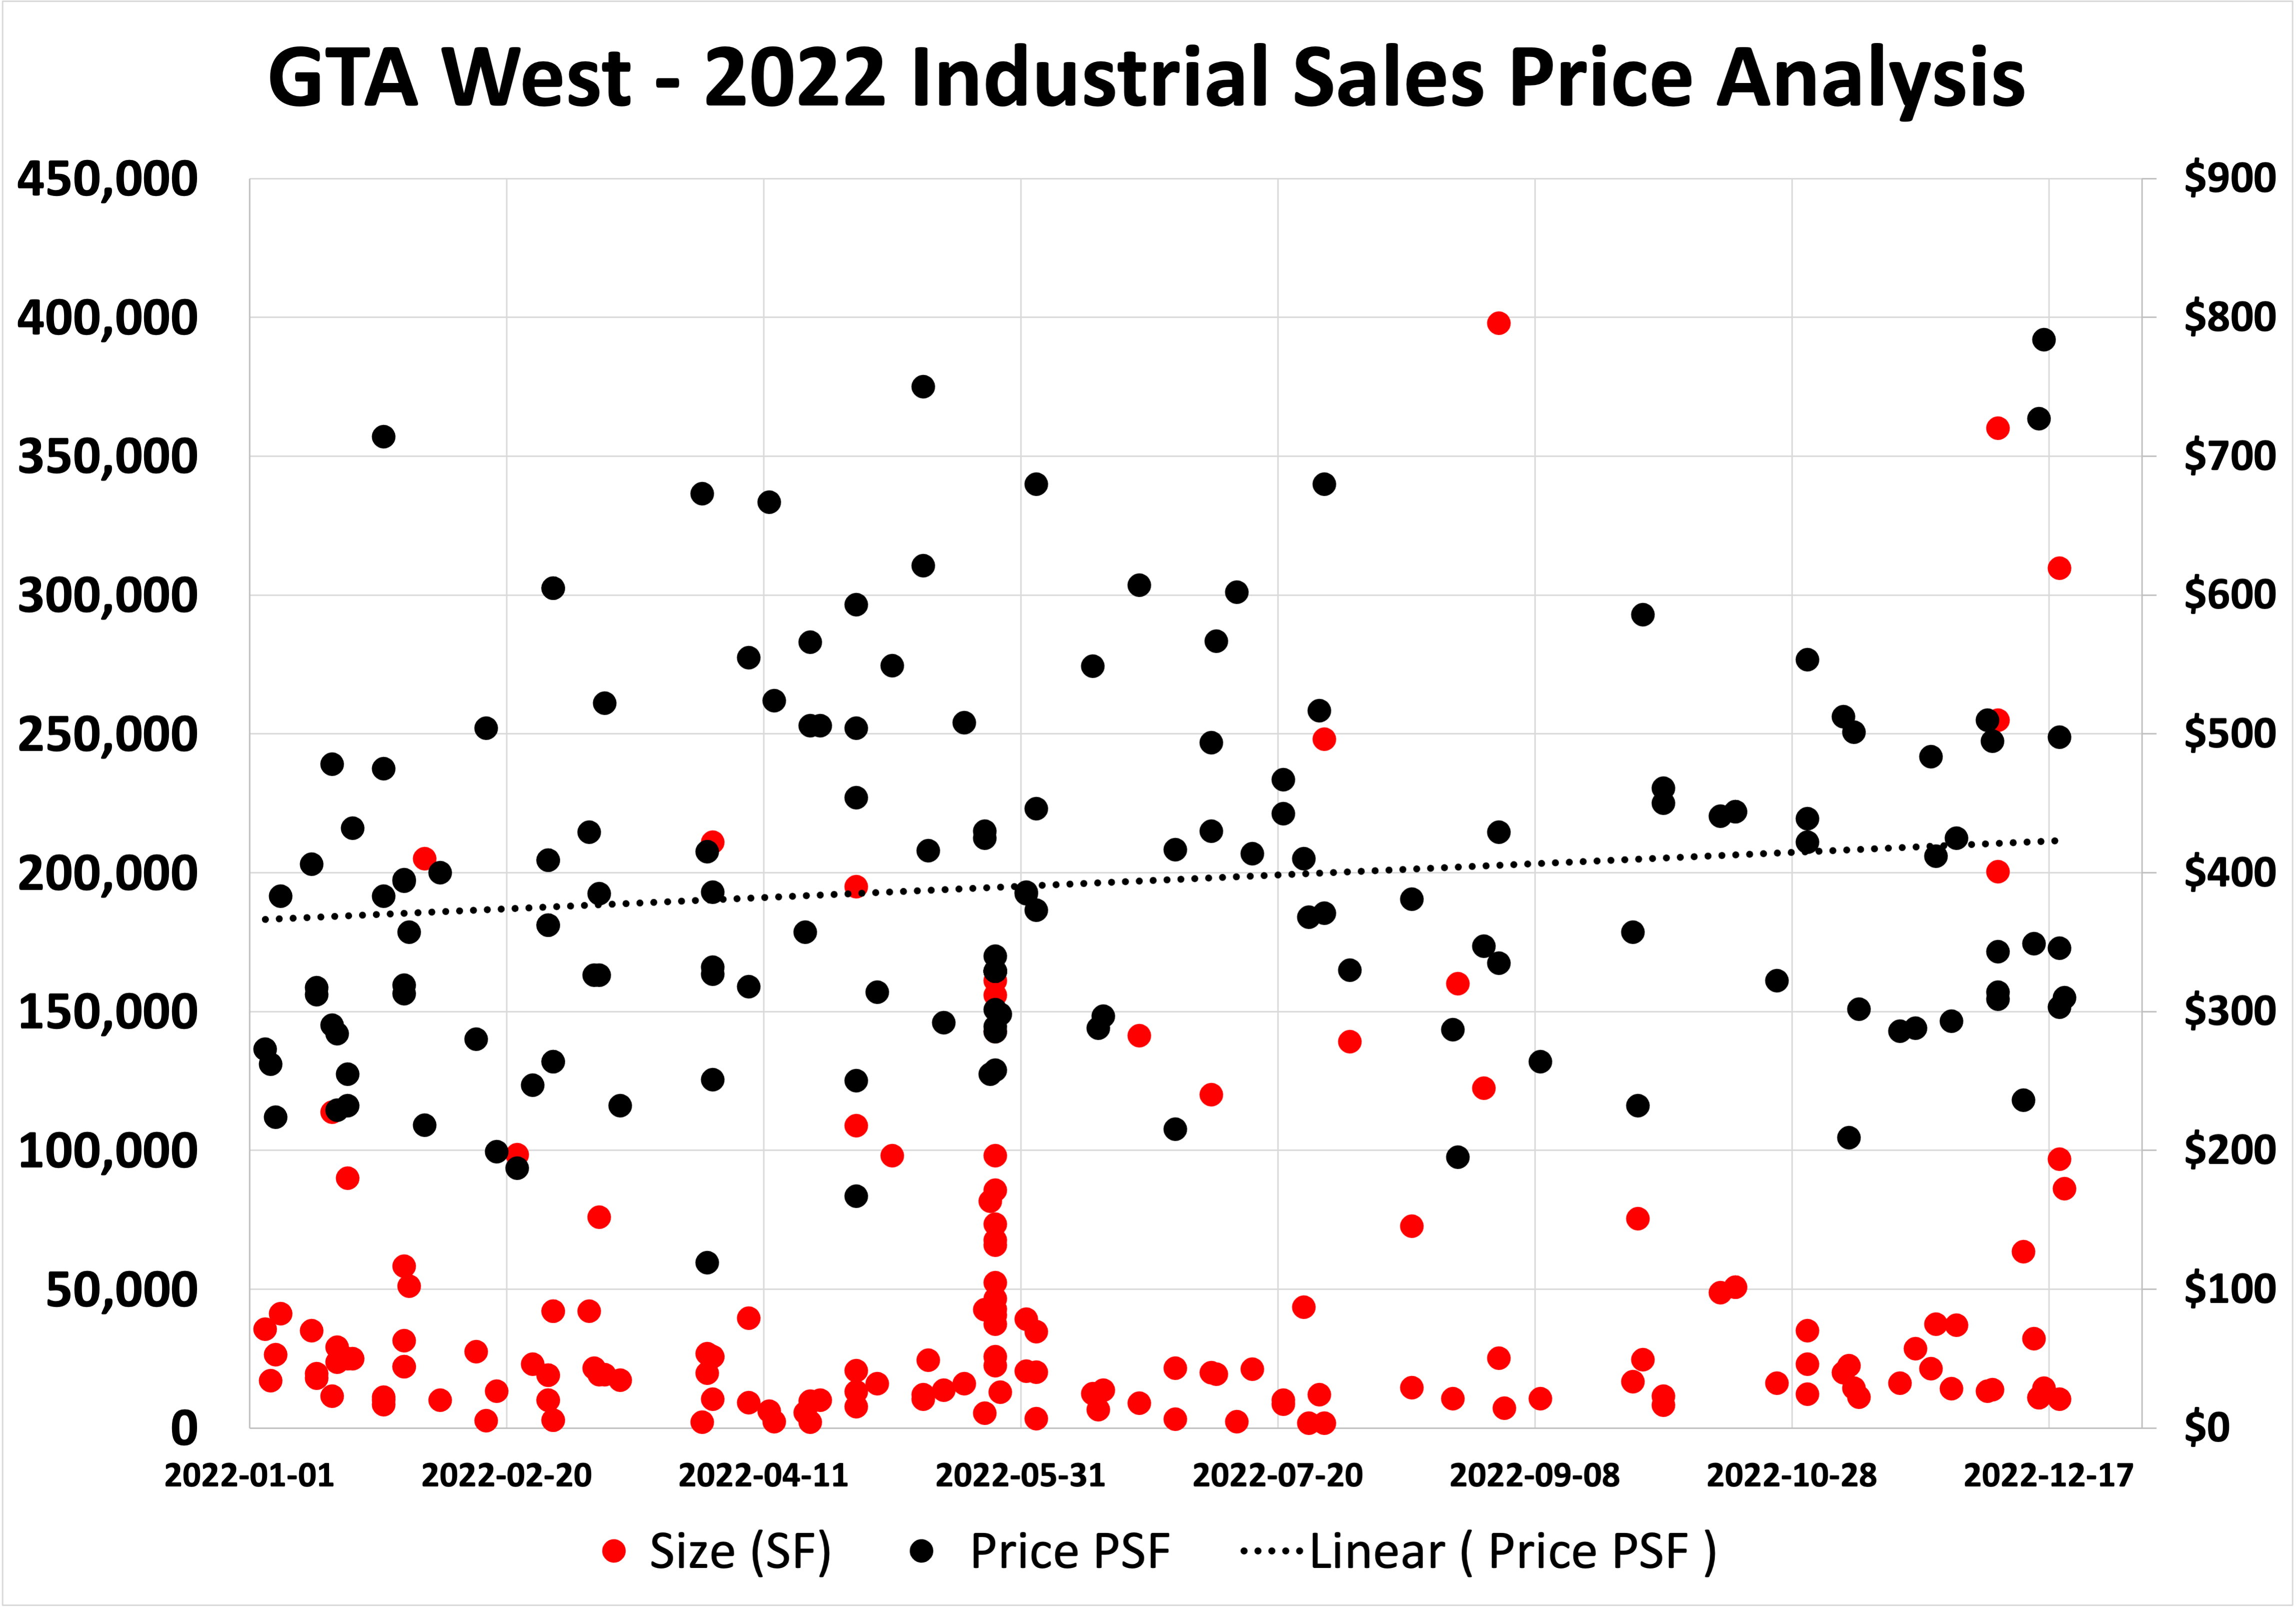
GTA West – 2022 Industrial Sales Analysis. Source: RealNet.
GTA West Market Industrial Sales
- Average Size: 52,503 SF
- Average Sale Price: $15,879,021
- Average Price PSF: $390.94
When compared to our analysis of the Central and East regions, we still see a slowdown in transactions in Q3 2022, although not as pronounced. The North region generally has fewer purchase opportunities – even prior to the interest rate hikes. Meanwhile, the West markets saw a number of large portfolio acquisitions early and late in the year, which may throw off our analysis. Whether they were completed because the rate hikes were expected or not is difficult to confirm.
Looking at the overall sales volume, we see the North markets follow a similar pattern to the East regions (covered last week) whereby Q4 2022 set a record-level for the year after a significant drop-off in Q3. Additionally, the West markets tracked similarly to the Central region with a halving of volume quarter-over-quarter in Q3 2022, followed by a bounce-back in Q4.
We posit that this may have been due to investors adjusting to the new environment or making moves to hit end-of-year objectives. The real proof in the pudding will be to see how activity carries forward into 2023.
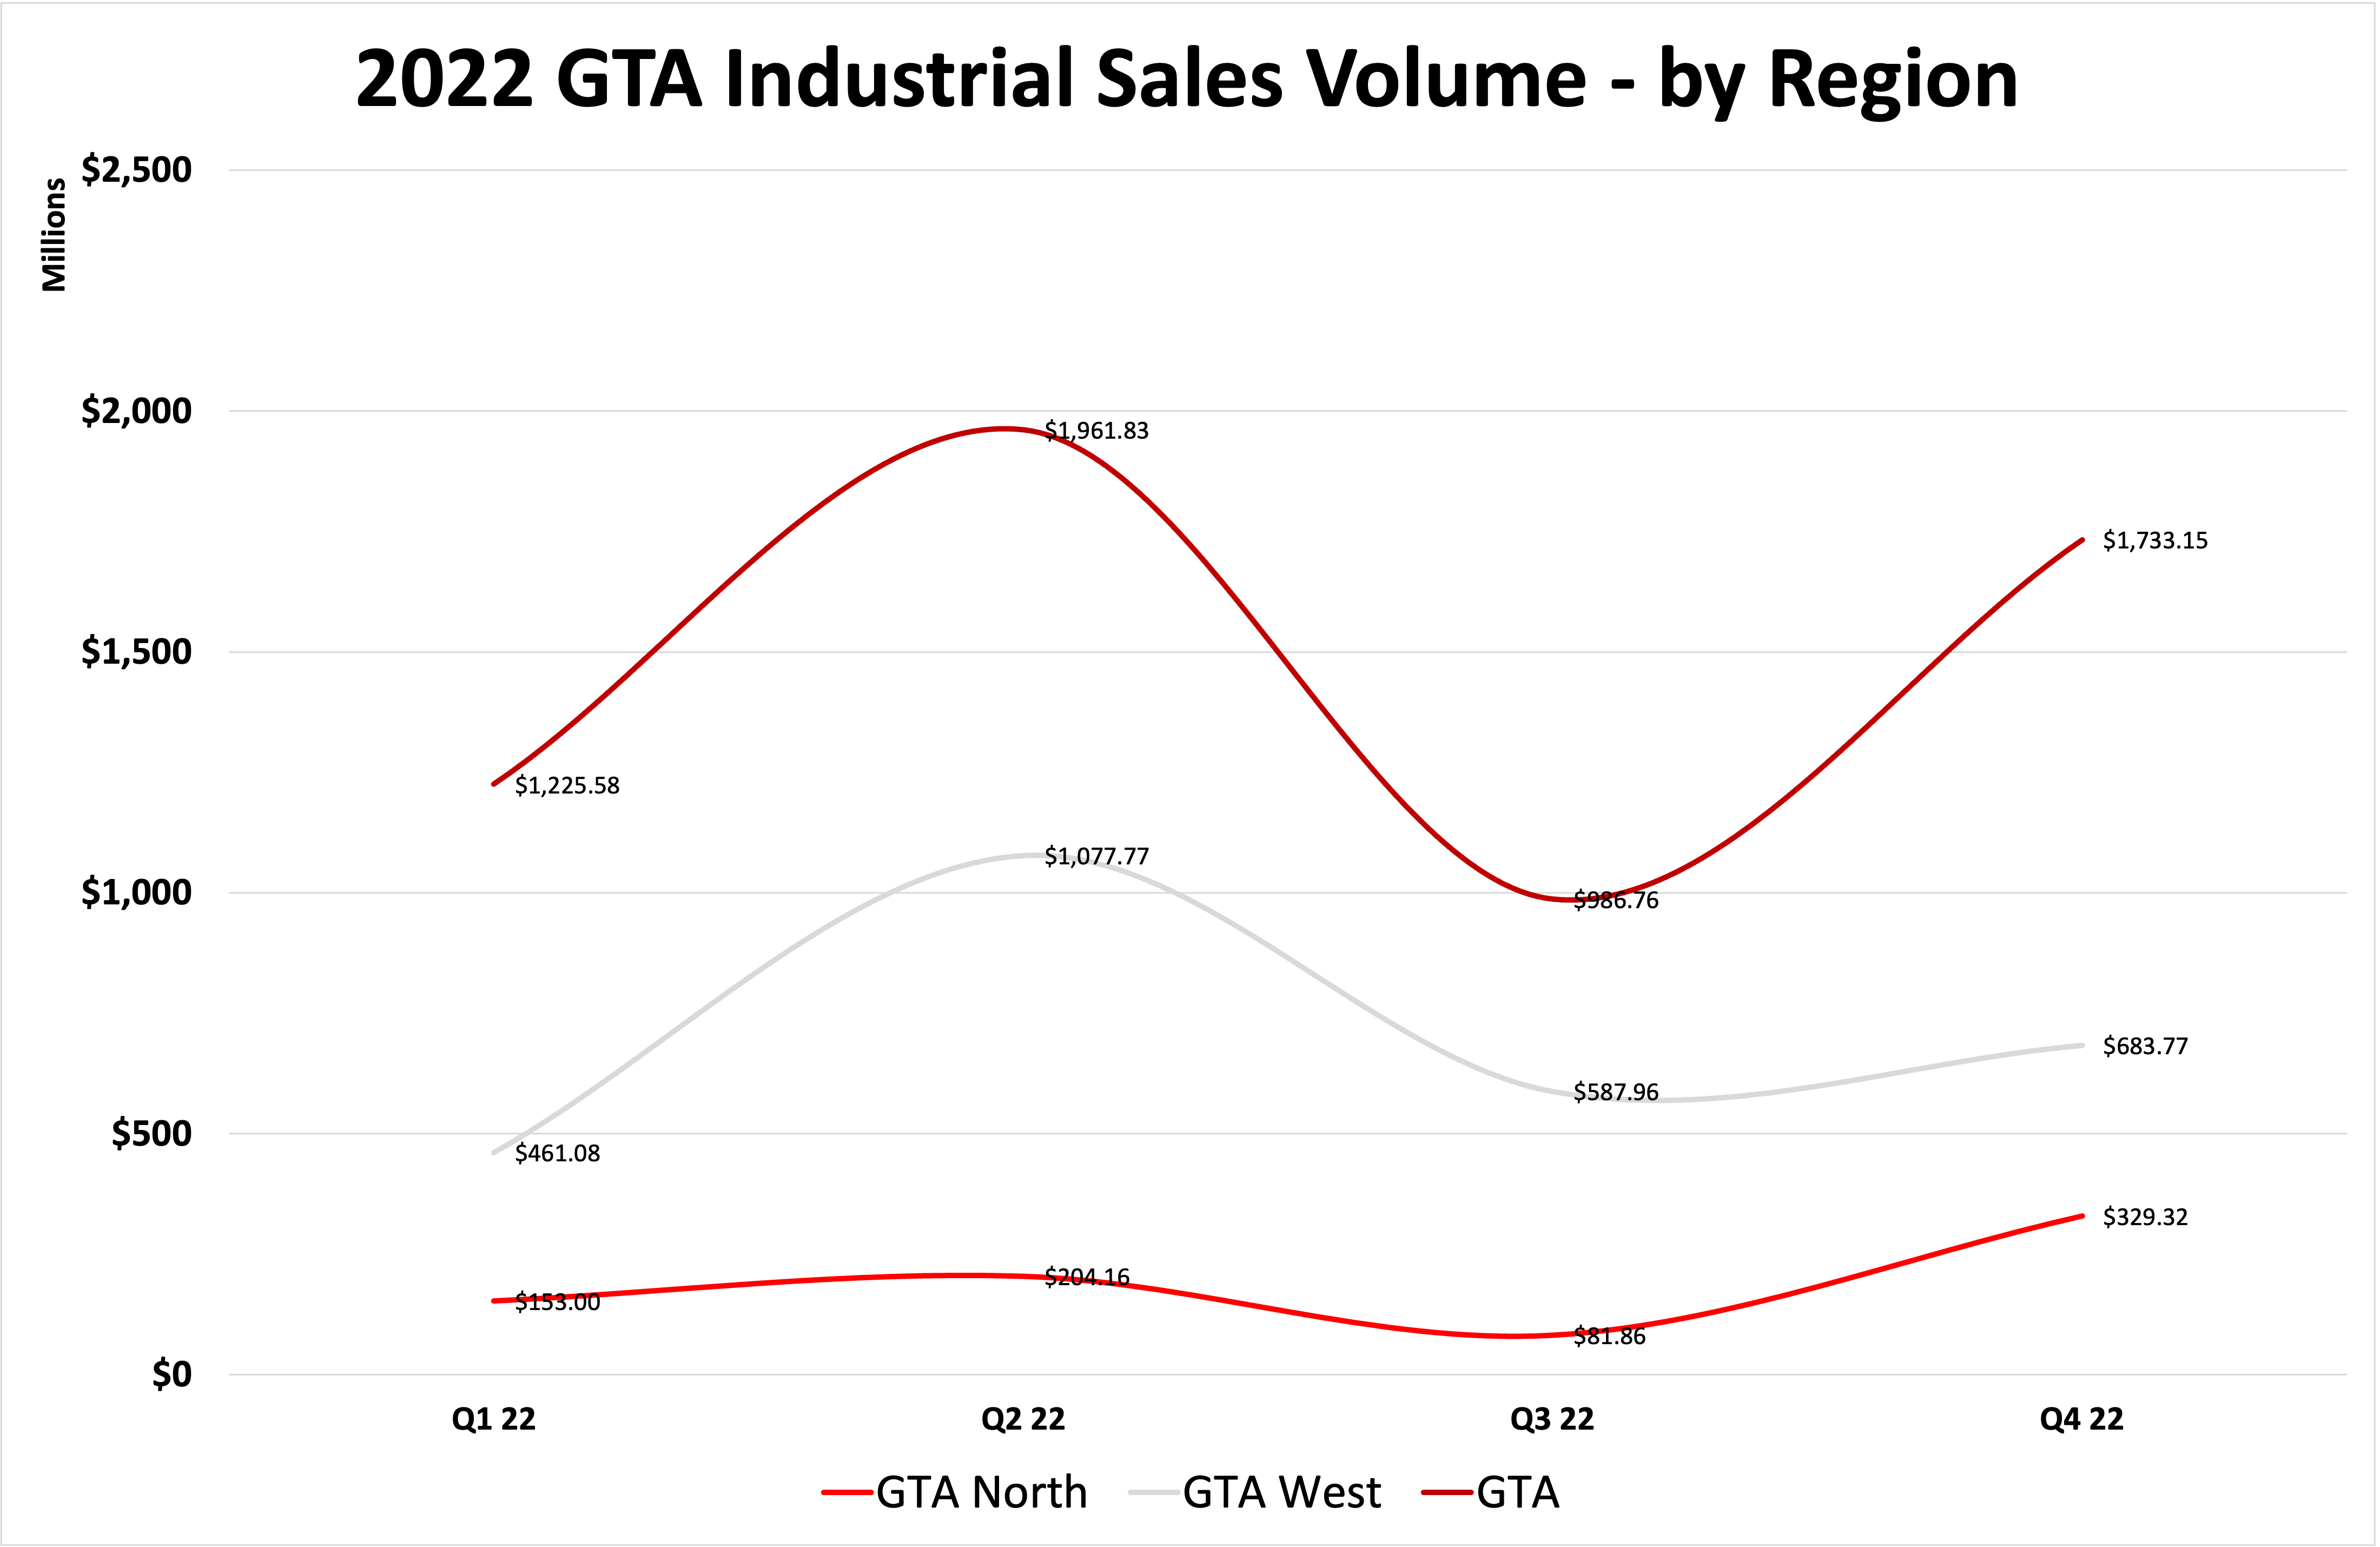
GTA Industrial Sales Comparison – GTA Proper, North, West Markets.
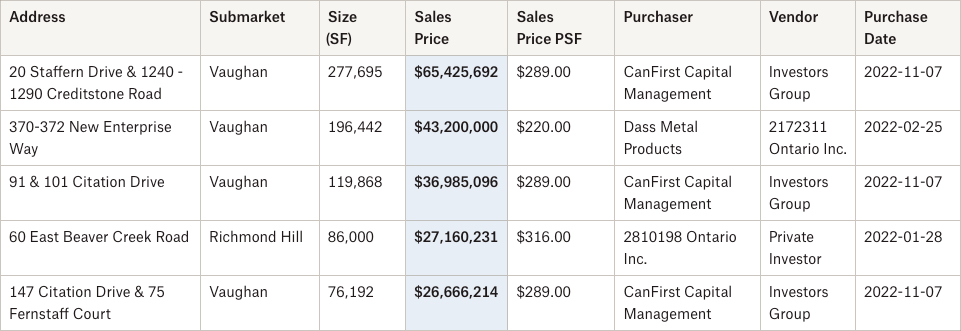
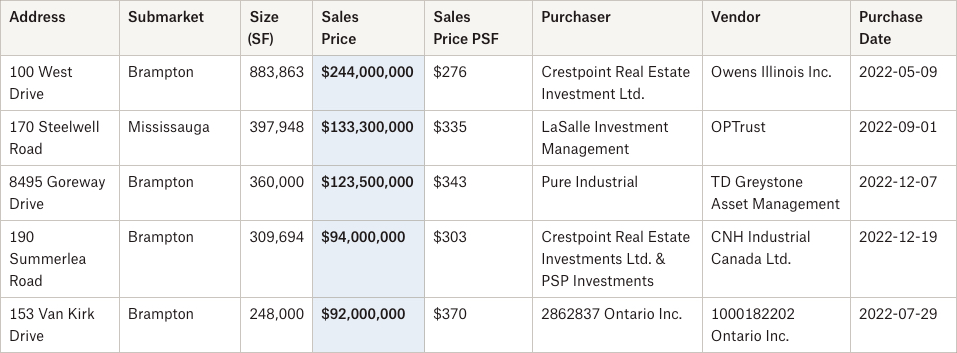
To conclude our analysis of sales trends and activity in the GTA North and West markets, we will highlight the top 5 industrial sales for each region in 2022.
Top 5 Industrial Sales in 2022 – GTA North Markets
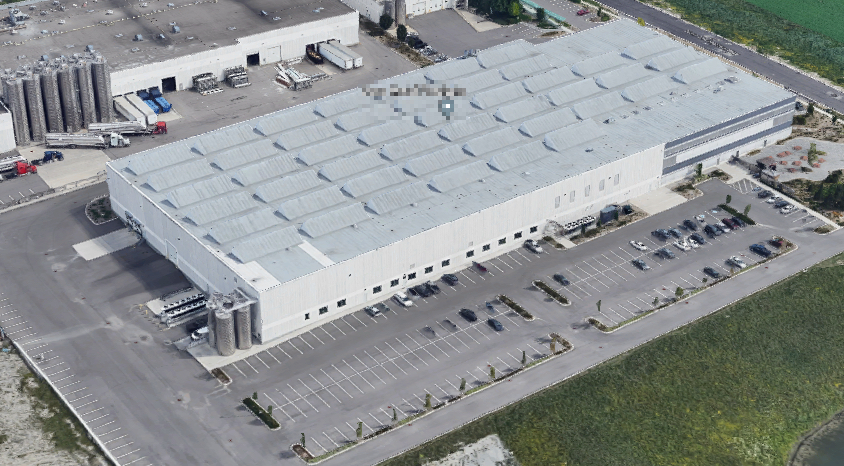
Top 5 Industrial Sales in 2022 – GTA West Markets
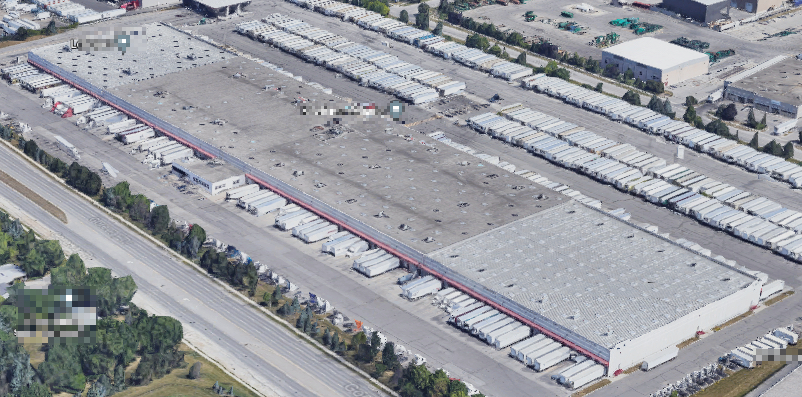
8495 Goreway Drive, Brampton. Source: Google.
Conclusion
The truth is, interest rates are having a profound effect on a specific subset of investors and occupiers. Those who engineer their businesses within tight margins or who prefer to cashflow their investments may be on the sidelines or revert to a leasing strategy. Yet, those with enormous amounts of dry powder may see a thinning buyer pool, coupled with continued inflation, as a perfect moment to step in and deploy capital at more reasonable prices.
Active Parties in the market are accepting the fact that growth is slowing; and they’re all the more relieved for it. Rents and pricing remain strong – and have locked in their gains. Looking forward, planning will become more predictable and negotiations may become simpler as value targets no longer move at 30% or 40% annual increases.
Deals may become more difficult to execute, and relationships will likely a key differentiator for parties to successfully complete transactions, but whatever the case, the GTA industrial market is incredibly robust.
With that said, if you would like a confidential consultation or a complimentary opinion of value of your industrial asset, please give us a call.
Until next week…
Goran Brelih and his team have been servicing Investors and Occupiers of Industrial properties in Toronto Central and Toronto North markets for the past 30 years.
Goran Brelih is an Executive Vice President for Cushman & Wakefield ULC in the Greater Toronto Area.
Over the past 30 years, he has been involved in the lease or sale of approximately 25.7 million square feet of industrial space, valued in excess of $1.6 billion dollars while averaging between 40 and 50 transactions per year and achieving the highest level of sales, from the President’s Round Table to Top Ten in GTA and the National Top Ten.
Goran is a Past President of the SIOR ‐ Society of Industrial and Office Realtors, Central Canadian Chapter.
Specialties:
Industrial Real Estate Sales and Leasing, Investment Sales, Design-Build and Land Development
About Cushman & Wakefield ULC.
Cushman & Wakefield (NYSE: CWK) is a leading global real estate services firm that delivers exceptional value for real estate occupiers and owners. Cushman & Wakefield is among the largest real estate services firms with approximately 53,000 employees in 400 offices and 60 countries.
In 2020, the firm had revenue of $7.8 billion across core services of property, facilities and project management, leasing, capital markets, valuation and other services. To learn more, visit www.cushmanwakefield.com.
For more information on GTA Industrial Real Estate Market or to discuss how they can assist you with your real estate needs please contact Goran at 416-756-5456, email at goran.brelih@cushwake.com, or visit www.goranbrelih.com.
Goran Brelih, SIOR
Executive Vice President, Broker
Cushman & Wakefield ULC, Brokerage.
www.cushmanwakefield.com
Office: 416-756-5456
Mobile: 416-458-4264
Mail: goran.brelih@cushwake.com
Website: www.goranbrelih.com


