
August 11th, 2023
What the industrial market wants, and what it has wanted so desperately for the last few years – is space.
Tenants crave space in which to operate and to help facilitate the growth of their business.
Especially as suppliers look to meet elevated demand, manufacturers to fulfill backlogs, and logistics firms to ensure both reliability and speed in delivery.
At the same time, these businesses are dealing with the maintenance of their existing footprints; whether that be upgrading to more modern buildings to allow for additional efficiencies (through racking or other management systems) or mitigating the sizeable jump in rents as their renewals come up.
Meanwhile, investors and developers have rushed to supply this much-needed inventory, despite the plethora of challenges faced along the way – from shutdowns and bottlenecks to increases in labour, land, and materials.
And all of this sets the stage for today.
Without any meaningful level of available space, making real estate decisions becomes that much more difficult and requires creative solutions. Long-term planning and prudence become that much more virtuous and necessary.
Without the flexibility to adjust, these same users are forced to accept higher costs; potentially occupying assets with less-than-ideal specifications or in locations which further complicate the day-to-day operations.
Perhaps then, our initial statement should be revised to:
“What the the industrial market wants, and what it has wanted so desperately for the last few years – is optionality.”
Having options provides a measure of power and precision; producing the best possible outcome.
So how do we create them?
Well, notwithstanding any major economic shock, or otherwise, that may quickly see users vacating space (as we saw in the office sector throughout and after the pandemic), the strongest lever remains, unsurprisingly, an abundance of capital. It’s a bit of a cop-out answer but they don’t say “cash is king” for no reason. While difficult to achieve at times, it can be engineered.
Second to capital is time.
The time to afford patient preparation in advance of planning and opportunity.
The space to wait until conditions are favourable.
The chance to carefully craft a strategy that takes into account the constraints of the business and broader economic landscape. To that end, that’s where an experienced broker can help.
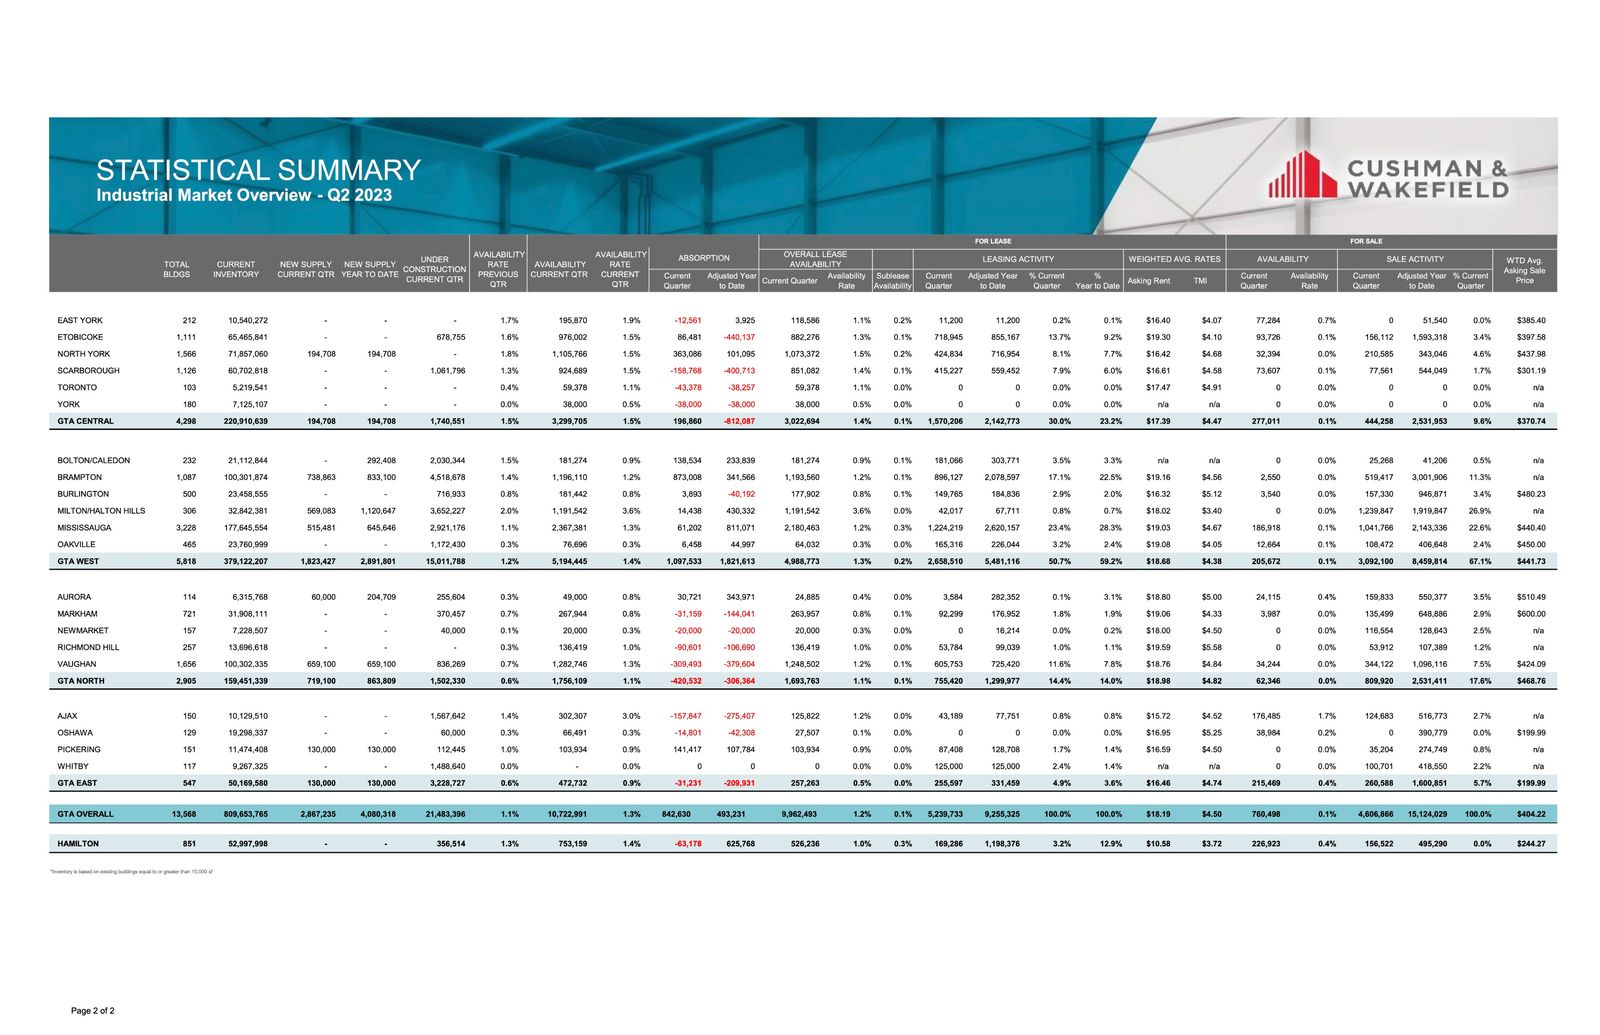
Key Takeaways from Q2 2023 – Toronto East Markets
- The availability rate increased from 0.6% to 0.9%, with 0.5% available for lease and 0.4% available for sale;
- We had 130,000 SF of new supply and 3,228,727 SF still under construction;
- We had negative absorption of 31,231 SF;
- The weighted average asking net rent was $16.46 PSF, up slightly from $16.04 the previous quarter, with additional rent of $4.74 PSF (an increase from $4.14 PSF); and
- The weighted average asking sale price was $199.99 PSF.
Why are the GTA East Markets in such demand?
Generally, the Toronto-East markets have strong economics – relatively inexpensive land compared to other markets in the GTA, better availability of land, better located industrial land with proximity to the City, relatively low development charges, and great access to major highways.
We have seen a number of major Users and Developers step in and make commitments on large pieces of land for spec development and design build, which amounts to millions of square feet being built and in the pipeline.
So, if you are an Investor, Landlord, or Owner-Occupier you may be wondering…
“How much is my property really worth?”
What rental rate can I expect? How much $/PSF would I be able to get if I sold my building?
These questions are being asked all the time.
The answer to this will depend on a range of factors, including:
- the age and size of the building,
- lot size,
- ceiling height,
- office component,
- parking,
- trucking access,
- truck parking if available, etc….
This week we are covering the Toronto-East Markets
(Pickering, Ajax, Whitby, Oshawa & Clarington)
Statistical Summary – GTA East Markets – Q2 2023


Q2 2023 GTA Industrial Market Overview – Source: Cushman & Wakefield
Properties Sold/Leased between April 2023 – June 2023, from 20,000 SF plus

827-843 Brock Road, Pickering
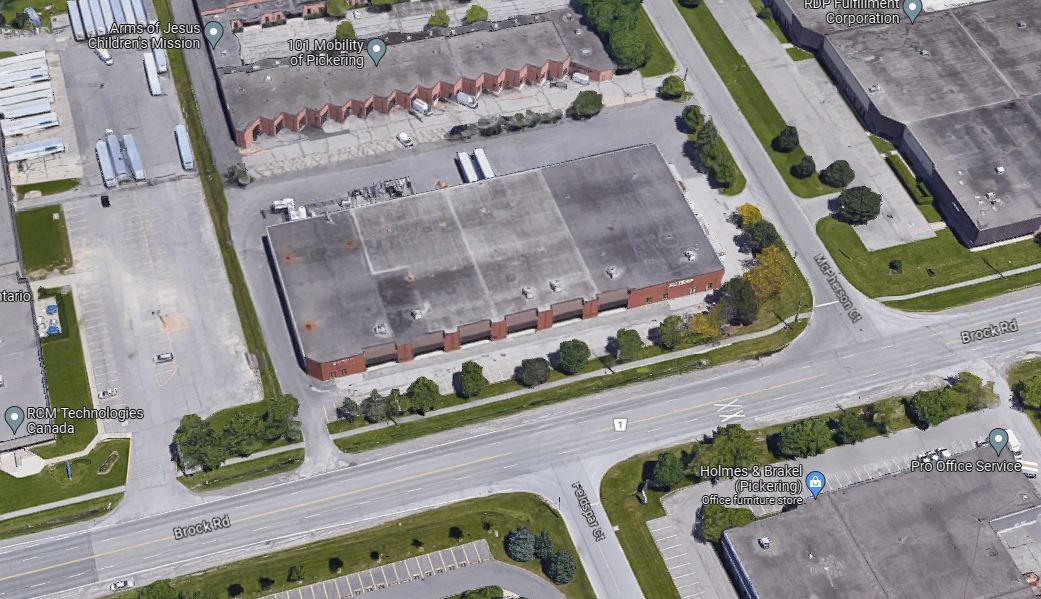
Properties Sold/Leased between April 2023 – June 2023, from 20,000 SF plus
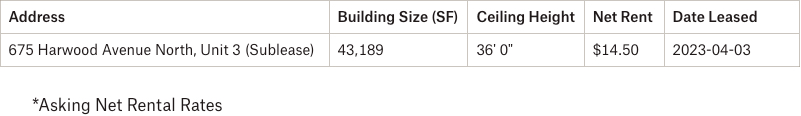
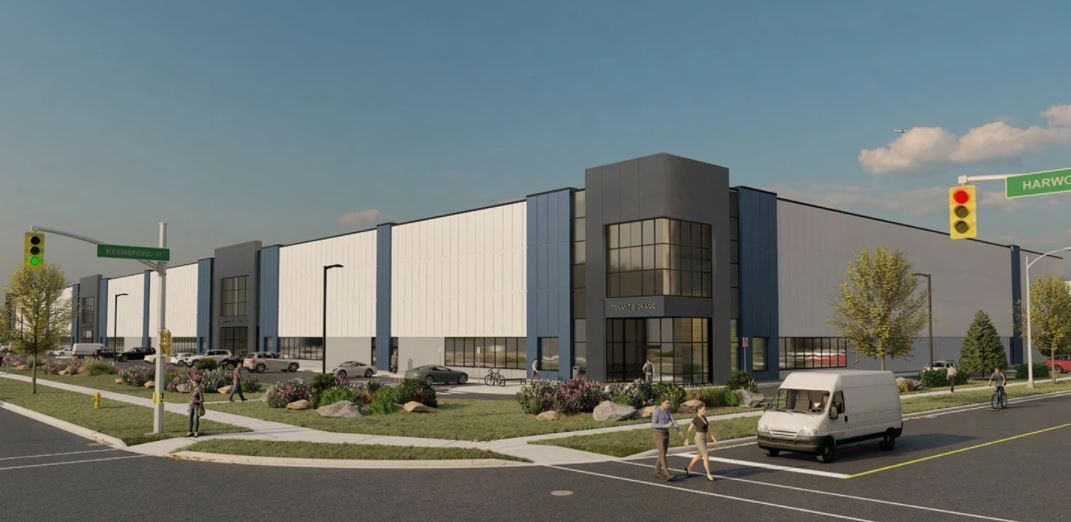
675 Harwood Avenue North, Ajax
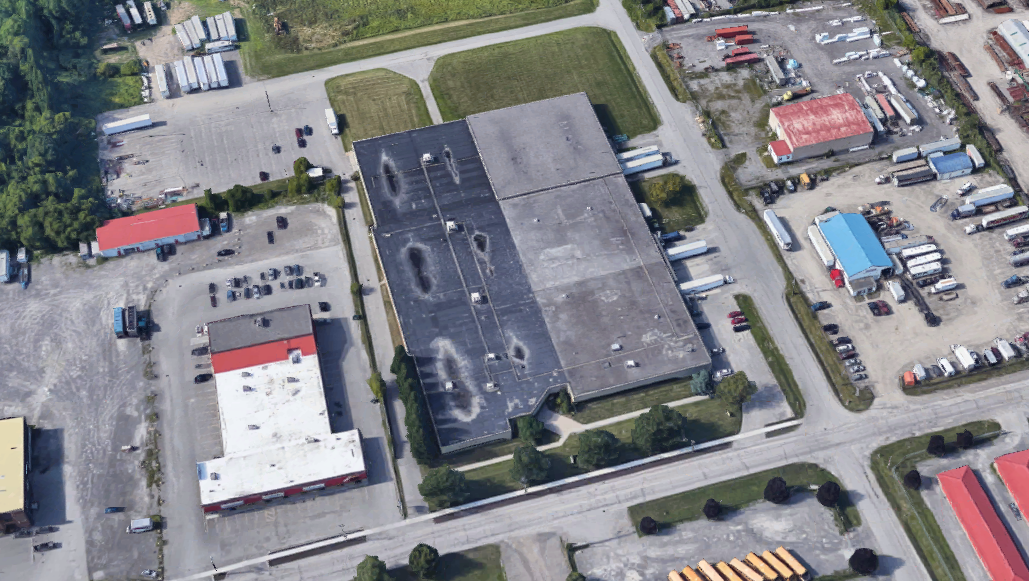
Properties Sold between April 2023 – June 2023, from 20,000 SF plus

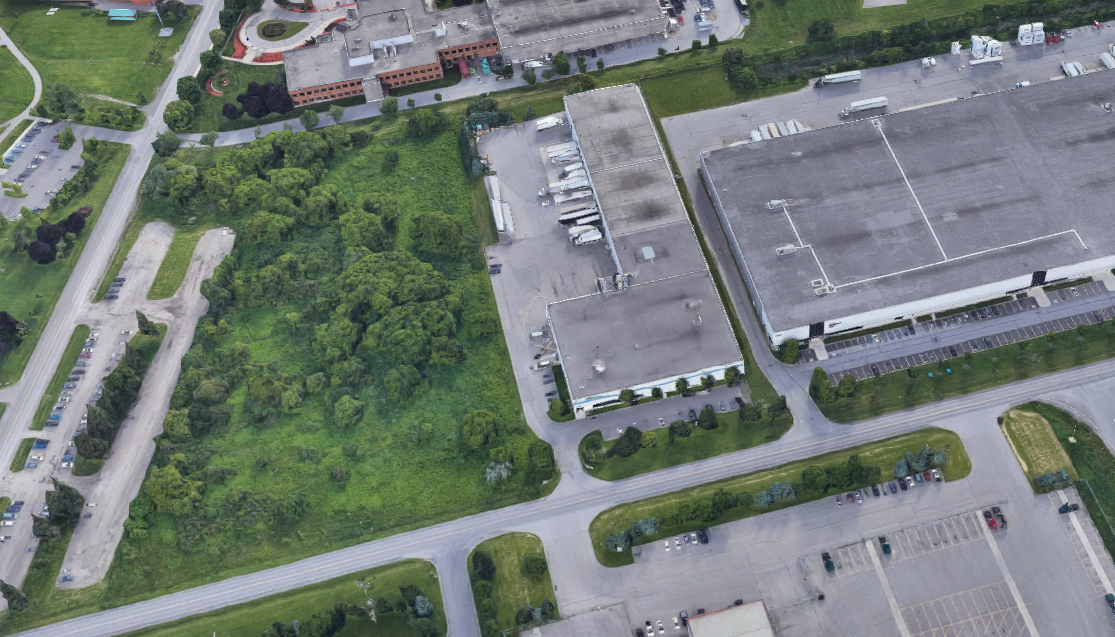
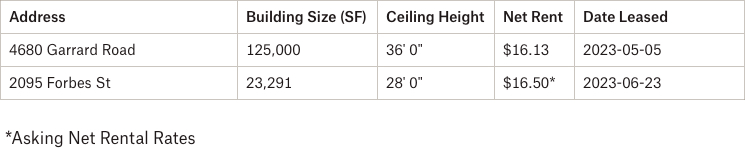
Properties Leased between April 2023 – June 2023, from 20,000 SF plus


1001 Thornton Road South, Oshawa
- Rental Rates: Currently, rental rates average $16.46 PSF net in the GTA East; the lowest of all GTA submarkets, where all of the others are already well over $17.00 PSF net. Despite this, average reported rents are just $0.93 PSF behind the Central markets, $2.22 PSF behind the West, and $2.50 PSF behind the North. We have already seen quite an increase in rental rates and land values in the East as they catch up to other Regions, however, we expect rents to increase at a slower, decelerating rate.
- Property Values: Property values, like rental rates, are considerably lower relative to the other GTA submarkets… but also increasing as investors and developers act on the opportunities and relative discount.
- Development Opportunities: We are seeing a lot more development than ever before as the GTA East now has more pipeline than the Central and North Regions (almost more than the two combined) at 3,228,727 SF under construction. Big players such as Panattoni, Carttera, Crestpoint, Blackwood, PIRET, etc. (to name a few) are all involved… and it will continue.
So, how much is your property really worth?
What rental rate can you expect or how much per SF would you be able to get if you sell your building? How much can we compress CAP rates to create even greater value?
Well, the answers to these questions will depend on a variety of factors, many of which we can quickly uncover in an assessment of your situation. And with our rental rates and valuations at all-time highs, and vacancy rates low, finding the right property is a real challenge.
Having said that, a lot of transactions are being done off the market.. and to participate in that, you should connect with experienced brokers that have long-standing relationships with property owners.
For a confidential consultation or a complimentary opinion of value of your property please give us a call.
Until next week…
Goran Brelih and his team have been servicing Investors and Occupiers of Industrial properties in Toronto Central and Toronto North markets for the past 30 years.
Goran Brelih is an Executive Vice President for Cushman & Wakefield ULC in the Greater Toronto Area.
Over the past 30 years, he has been involved in the lease or sale of approximately 25.7 million square feet of industrial space, valued in excess of $1.6 billion dollars while averaging between 40 and 50 transactions per year and achieving the highest level of sales, from the President’s Round Table to Top Ten in GTA and the National Top Ten.
Specialties:
Industrial Real Estate Sales and Leasing, Investment Sales, Design-Build and Land Development
About Cushman & Wakefield ULC.
Cushman & Wakefield (NYSE: CWK) is a leading global real estate services firm that delivers exceptional value for real estate occupiers and owners. Cushman & Wakefield is among the largest real estate services firms with approximately 53,000 employees in 400 offices and 60 countries.
In 2020, the firm had revenue of $7.8 billion across core services of property, facilities and project management, leasing, capital markets, valuation and other services. To learn more, visit www.cushmanwakefield.com.
For more information on GTA Industrial Real Estate Market or to discuss how they can assist you with your real estate needs please contact Goran at 416-756-5456, email at goran.brelih@cushwake.com, or visit www.goranbrelih.com.
Connect with Me Here! – Goran Brelih’s Linkedin Profile: https://ca.linkedin.com/in/goranbrelih
Executive Vice President, Broker
Cushman & Wakefield ULC, Brokerage.
www.cushmanwakefield.com
Office: 416-756-5456
Mobile: 416-458-4264
Mail: goran.brelih@cushwake.com
Website: www.goranbrelih.com