
Establishing True Valuations Across Differing Markets
August 18th, 2023
When the market has been riding a wave for so many years, when the natural equilibrium has been so far out of balance, and when industrial space has become so sought-after that we see an absolute explosion in development and both pre-leasing and renewals taking place two years out at triple the previous rents…
…it’s time to explore if there isn’t a better strategy to both acquire and manage real estate, especially if and when we see the market turn the other way.
What that strategy may be is undoubtedly unique to you and your organization’s objectives.
In past issues, we have explored the trend of tenants and developers moving out into secondary periphery markets, as well as investors looking at infill site developments and condo conversions for value-add plays. We have also taken a look at sale leasebacks for capital injections, design-builds to regain control over explosive rents, and creative ways to secure financing.
The proper course of action ultimately depends on the specific circumstances of a business, an asset, or a broader portfolio.
Historically, and especially throughout periods of balanced markets, real estate transactions have been more straightforward. Need to lease industrial space? Great, the market has several options to choose from, with reasonable pricing, terms, and competition. If negotiations don’t go your way, it’s likely that your second (or third) option will work just fine. If that doesn’t pan out, then you can find a suitable piece of land and construct the ideal facility for a modest cost and with solid financing. A similar train of thought would go for purchasing assets.
Today? When “game-theory-ing” out your next moves – each turn brings about more complexity and fewer options. Space is not so readily available. The competition to lease, purchase, and develop has grown fierce. Land, labour, and materials are scarce. And the cost to borrow is at a 40-year high.
While transacting has never been “easy” and few deals have ever gone “perfectly,” there is certainly more of a tradeoff – or a cost-benefit analysis – occurring now, unless you are well-positioned, flush with cash, or have been in the real estate game for well over a decade.
This doesn’t mean that success in the GTA’s industrial real estate market is impossible, it simply means decisions have a greater impact, and they should be made to move you at least one step closer to the ideal end-game.
As alluded to, the market will eventually turn, and – when it does – bring about plenty of opportunity for those ready to capitalize. In the meantime, there exist methods to secure space, mitigate cost increases, and leverage your industrial real estate to both drive your business forward and provide predictable income.
So with that said, let’s examine how each of the Greater Toronto Area regions performed in Q2 2023, and where we expect the market to go moving forward.
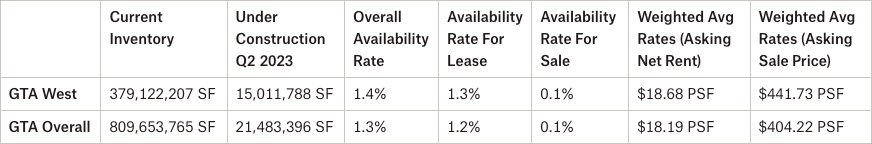
- The availability rate increased from 1.2% to 1.4%, with 1.3% available for lease and 0.1% available for sale;
- We had 1,823,427 SF of new supply and 15,011,788 SF still under construction;
- We had 1,097,533 SF of absorption;
- Brampton achieved the highest weighted asking net rental rates in Q2 2023 at $19.16 PSF, followed by Oakville at $19.08 PSF and Mississauga at $19.03 PSF;
- The weighted average asking net rent was $18.68 PSF, up slightly from $18.28 the previous quarter, with additional rent of $4.38 PSF (a decrease from $4.48 PSF); and
- The weighted average asking sale price decreased from $444.58 PSF to $441.73 PSF.
Why are the GTA West Markets in such demand?
The GTA West Industrial Markets are by far the largest industrial markets in the GTA, representing about 46.8% of GTA Industrial Inventory, or about 379,122,207 SF. The GTA West Markets were active this quarter and with more than 15,011,788 SF under construction.
So, if you are an Investor, Landlord, or Owner-Occupier you may be wondering…
“How much is my property really worth?”
What rental rate can I expect? How much $/PSF would I be able to get if I sold my building?
These questions are being asked all the time.
The answer to this will depend on a range of factors, including:
- the age and size of the building,
- lot size,
- ceiling height,
- office component,
- parking,
- trucking access,
- truck parking if available, etc….
This week we are covering the Toronto-West Markets
(Mississauga, Brampton, Oakville, Milton, Caledon, Burlington & Halton Hills)
Statistical Summary – GTA West Markets – Q2 2023


Properties Sold between April 2023 – June 2023, from 20,000 SF plus
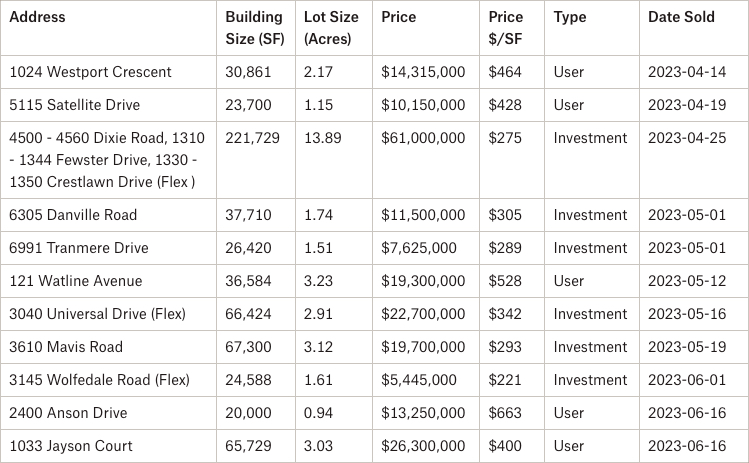
3610 Mavis Road, Mississauga
Properties Leased between April 2023 – June 2023, from 20,000 SF plus


6780 Creditview Road, Mississauga
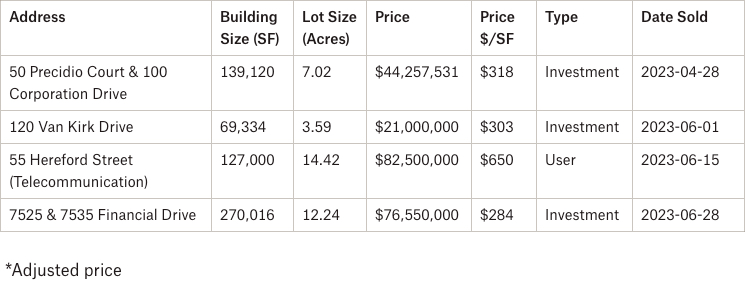
7525 & 7535 Financial Drive, Brampton
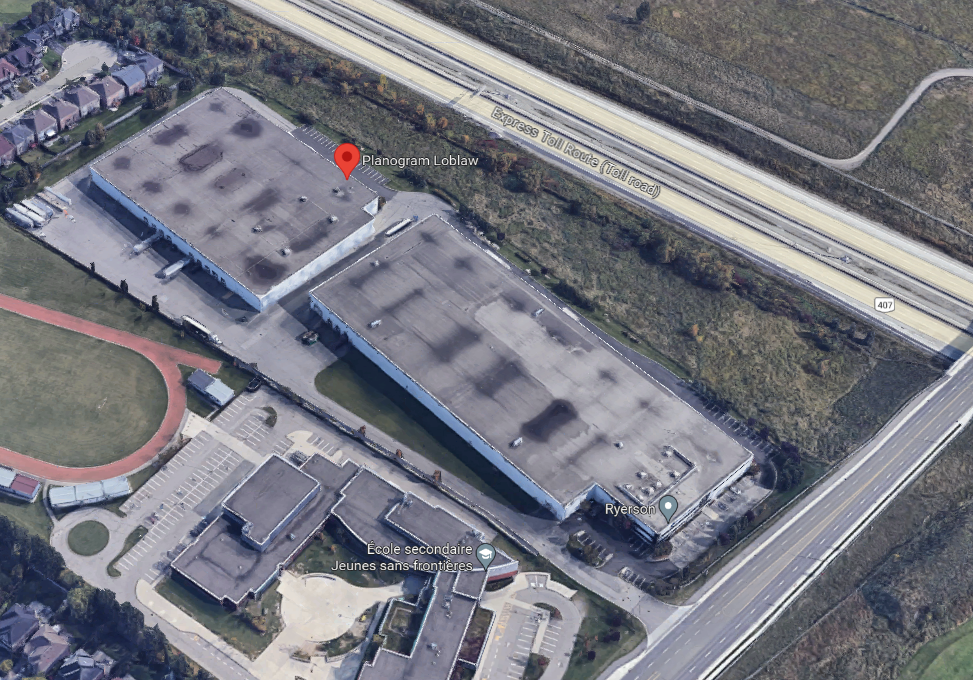
Properties Leased between April 2023 – June 2023, from 20,000 SF plus


1 Hereford Street, Brampton

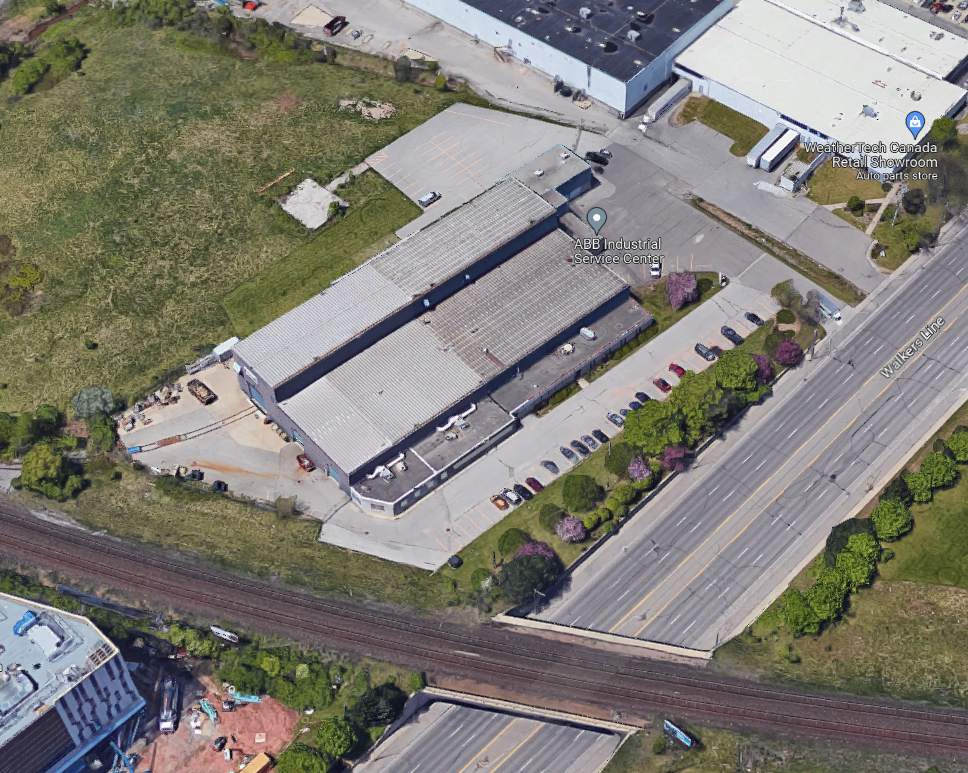
1150 Walkers Line, Burlington
Properties Leased between April 2023 – June 2023, from 20,000 SF plus
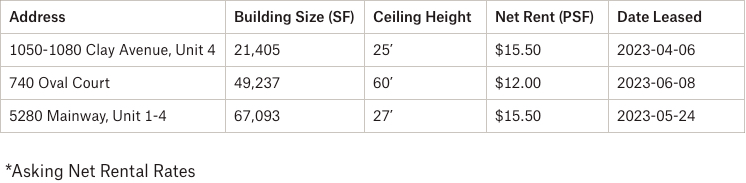
740 Oval Court, Burlington
Properties Sold between April 2023 – June 2023, from 20,000 SF plus
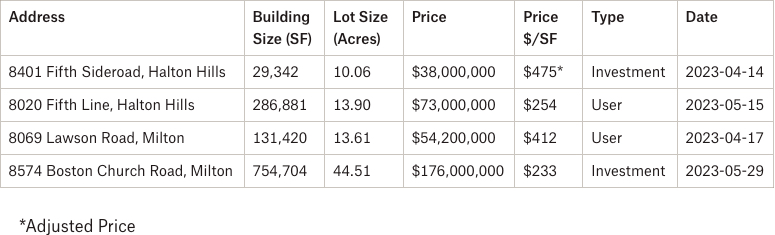
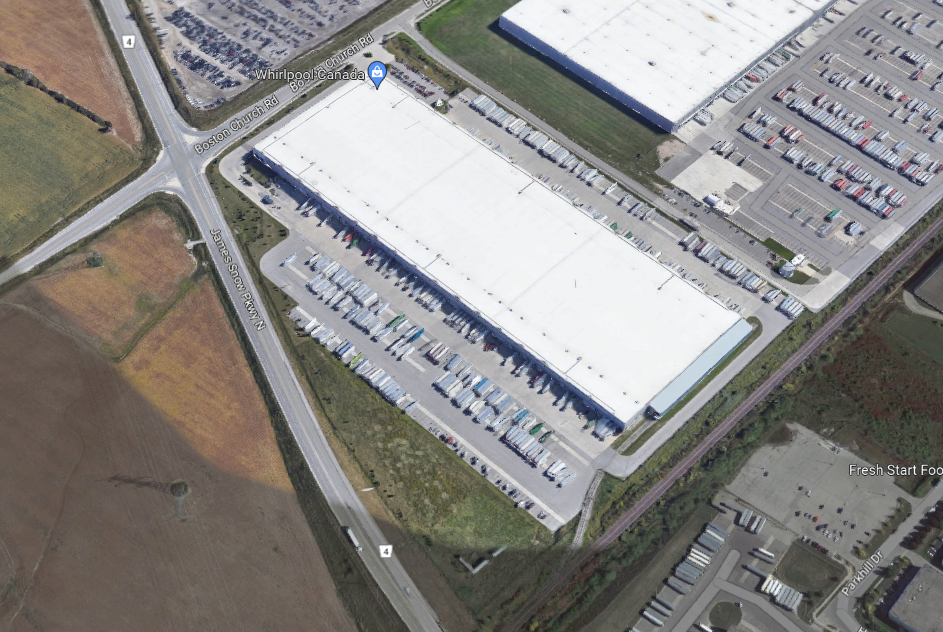
8574 Boston Church Road, Milton
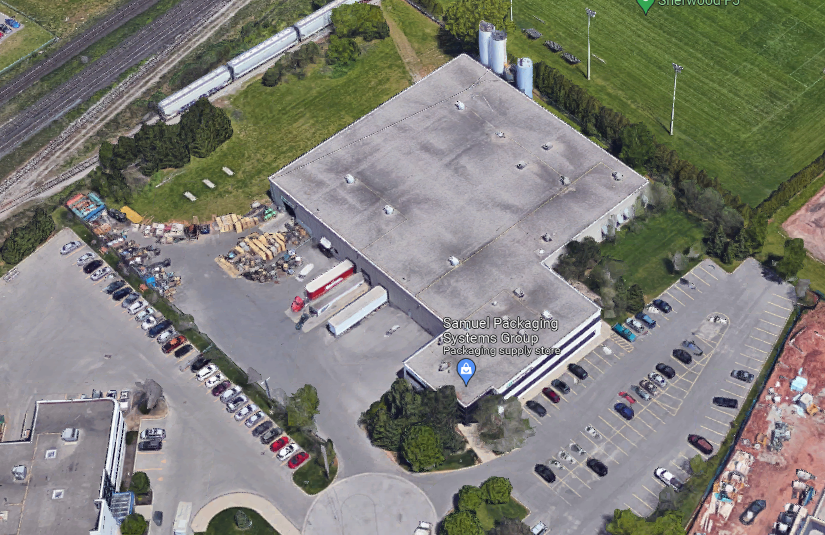
Properties Leased between April 2023 – June 2023, from 20,000 SF plus
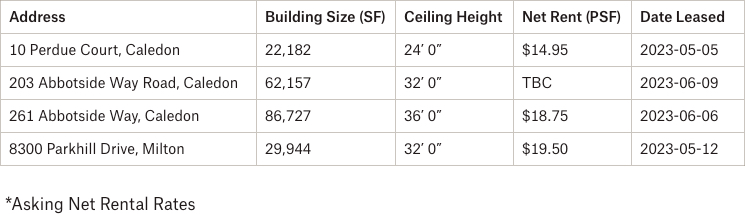
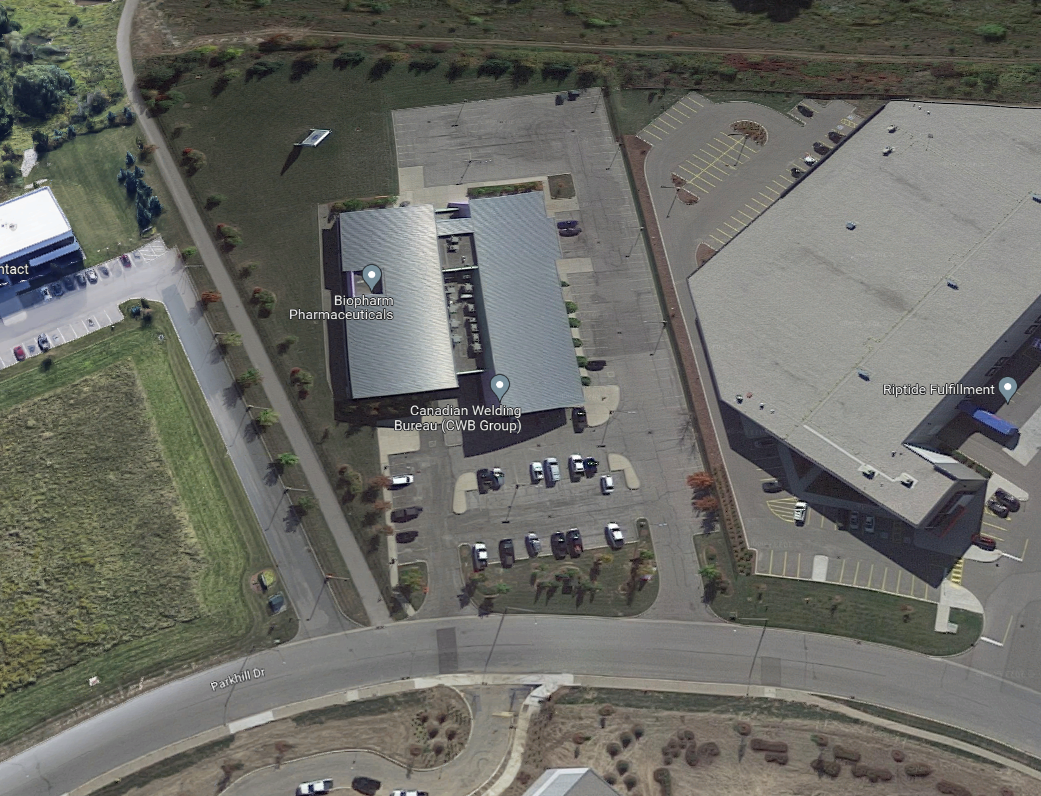
8300 Parkhill Drive, Milton
Properties Sold/Leased between April 2023 – June 2023, from 20,000 SF plus

2340 Winston Park Drive, Oakville
Portfolio Sales
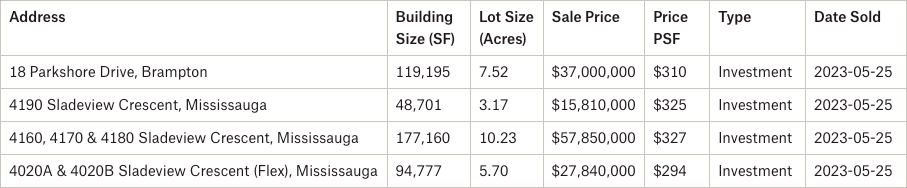
The subject properties are part of the NYX Capital Corp. – SmartStop Self Storage Ontario Industrial Portfolio 2023, which consists of seven properties in Ontario. The portfolio was purchased for $252,033,926 and contains a gross leasable area of approximately 811,937 square feet, representing an aggregate price per square foot of $310.

The subject properties are part of the BentallGreenOak – Pure Industrial Peel Industrial Portfolio 2023, which consists of seven properties in Peel. The portfolio was purchased for $138,500,000 and contains a gross leasable area of approximately 442,008 square feet, representing an aggregate price per square foot of $313.
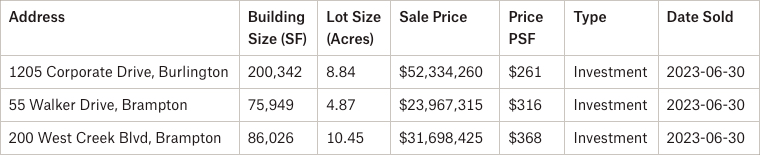
The subject properties are part of the Morguard – BMO GTA Industrial Portfolio 2023, which consists of 3 properties. The portfolio was purchased for $108,000,000 and contains a gross leasable area of approximately 362,317 square feet, representing an aggregate price per square foot of $298.
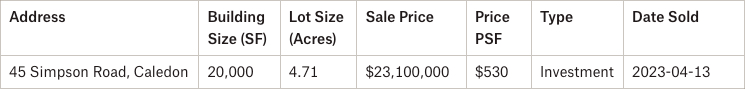
The subject properties are part of the S&R Trucking – BVD Group Caledon Industrial/ICI Land Portfolio 2023, which consists of two assets – one industrial and one land – in Caledon, Ontario. The portfolio was purchased for $36,250,000.
What Lies Ahead
- Rental Rates: We see many transactions achieving in excess of $16-18 PSF net. We are also hearing that some of the current developments are increasing their price guidance to above $19-20 PSF net. That trend will continue.
- Property Values: The average weighted asking sale price for the GTA-West markets in Q2 2023 was $441.73 PSF. Depending on the submarket, we would expect values to further increase due to the lack of available properties for sale. Despite economic uncertainty and rising interest rates, and even though the buyer pool may have thinned for some investors and operators, we continue to see major deals taking place.
- Development Opportunities: In the second quarter of 2024, we had approximately 15 million square feet under construction in the GTA-West markets. This represents about 70% of all new development across the GTA (21.5 million SF), with the bulk of activity taking place in Brampton (4.52 MSF), Milton/Halton Hills (3.65 MSF), and Mississauga (2.92 MSF).
Conclusion:
So, how much is your property really worth?
What rental rate can you expect or how much per SF would you be able to get if you sell your building? How much can we compress CAP rates to create even greater value?
Well, the answers to these questions will depend on a variety of factors, many of which we can quickly uncover in an assessment of your situation. And with our rental rates and valuations at all-time highs, and vacancy rates low, finding the right property is a real challenge.
Having said that, a lot of transactions are being done off the market.. and to participate in that, you should connect with experienced brokers that have long-standing relationships with property owners.
For a confidential consultation or a complimentary opinion of value of your property please give us a call.
Until next week…
Goran Brelih and his team have been servicing Investors and Occupiers of Industrial properties in Toronto Central and Toronto North markets for the past 30 years.
Goran Brelih is an Executive Vice President for Cushman & Wakefield ULC in the Greater Toronto Area.
Over the past 30 years, he has been involved in the lease or sale of approximately 25.7 million square feet of industrial space, valued in excess of $1.6 billion dollars while averaging between 40 and 50 transactions per year and achieving the highest level of sales, from the President’s Round Table to Top Ten in GTA and the National Top Ten.
Specialties:
Industrial Real Estate Sales and Leasing, Investment Sales, Design-Build and Land Development
About Cushman & Wakefield ULC.
Cushman & Wakefield (NYSE: CWK) is a leading global real estate services firm that delivers exceptional value for real estate occupiers and owners. Cushman & Wakefield is among the largest real estate services firms with approximately 53,000 employees in 400 offices and 60 countries.
In 2020, the firm had revenue of $7.8 billion across core services of property, facilities and project management, leasing, capital markets, valuation and other services. To learn more, visit www.cushmanwakefield.com.
For more information on GTA Industrial Real Estate Market or to discuss how they can assist you with your real estate needs please contact Goran at 416-756-5456, email at goran.brelih@cushwake.com, or visit www.goranbrelih.com.
Connect with Me Here! – Goran Brelih’s Linkedin Profile: https://ca.linkedin.com/in/goranbrelih
Goran Brelih, SIOR
Executive Vice President, Broker
Cushman & Wakefield ULC, Brokerage.
www.cushmanwakefield.com
Office: 416-756-5456
Mobile: 416-458-4264
Mail: goran.brelih@cushwake.com
Website: www.goranbrelih.com