
August 22nd, 2025
The most common questions among those deep in the industrial real estate market likely fall into the general pattern of “Where in the cycle are we?”
Or, “Have we hit the bottom yet?”
Or even, “When will things turn around?”
Because for the past several years now, the broader economic landscape has been marred by uncertainty. First it was the economic lockdowns, then the brief but spectacular boom in logistics and e-commerce; followed closely by supply chain bottlenecks and rising prices, and the resulting sharp increase in interest rates.
Since that initial wave of blockbuster deals and a behemoth pipeline of new inventory, things have trailed off, with a flurry of sublets, delayed projects, and a general mismatch in expectations between Buyers and Sellers; Landlords and Tenants.
Not that we needed it, but other headwinds, such as global conflicts and tariffs and trade talks have only made things less certain – with scores of businesses pushing off decisions while capital sat on the sidelines.
Transactions still took place, as they always do. People can’t wait forever. Yet overall confidence never really materialized that we were going to take another run into the next upswing.
That all said, it does feel like the market has probably come close to or already reached a bottoming out. Perhaps not in every submarket or asset class, nor for every class of property. But value plays are slowly popping up.
And those who were either priced out or who refused to partake in what they perceived were top-of-market valuations – the same groups who bought land at $500,000 per acre or $120 PSF – have now come out looking to redeploy capital and make their next moves. Likewise, businesses that focused on efficiencies and operating profits might look to take advantage of stabilized rents and values to scoop up good deals for the next 5, 10, or 15 years. Everything always moves in cycles. It’s not quite certain where we currently sit, although for the first time in a long time, it feels as if the broader market is holding steady, albeit in the same cautious way.
So without further ado, let’s examine how each of the Greater Toronto Area regions performed in Q2 2025, and where we expect the market to go moving forward.
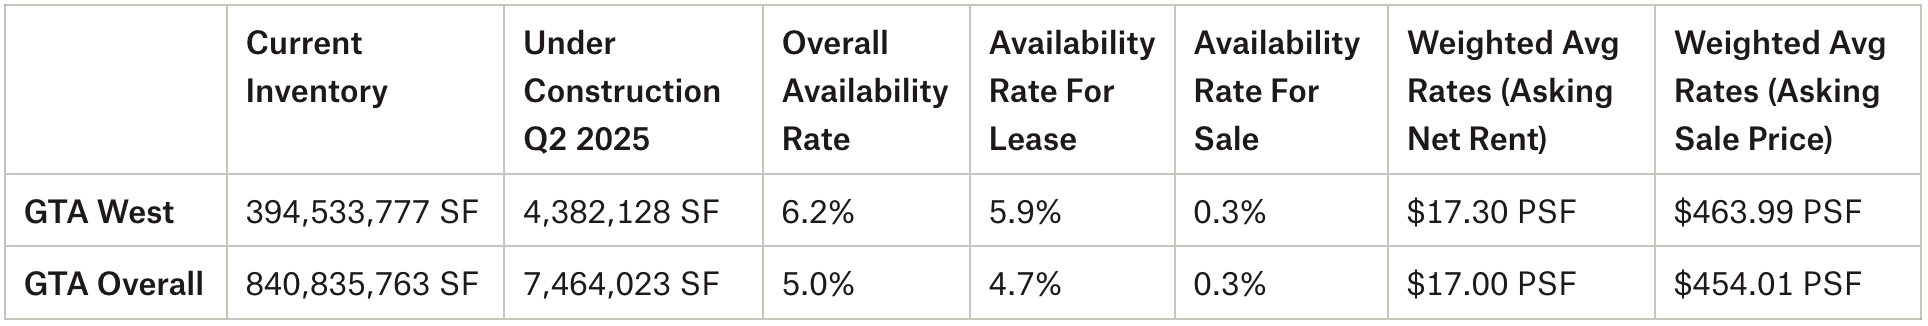
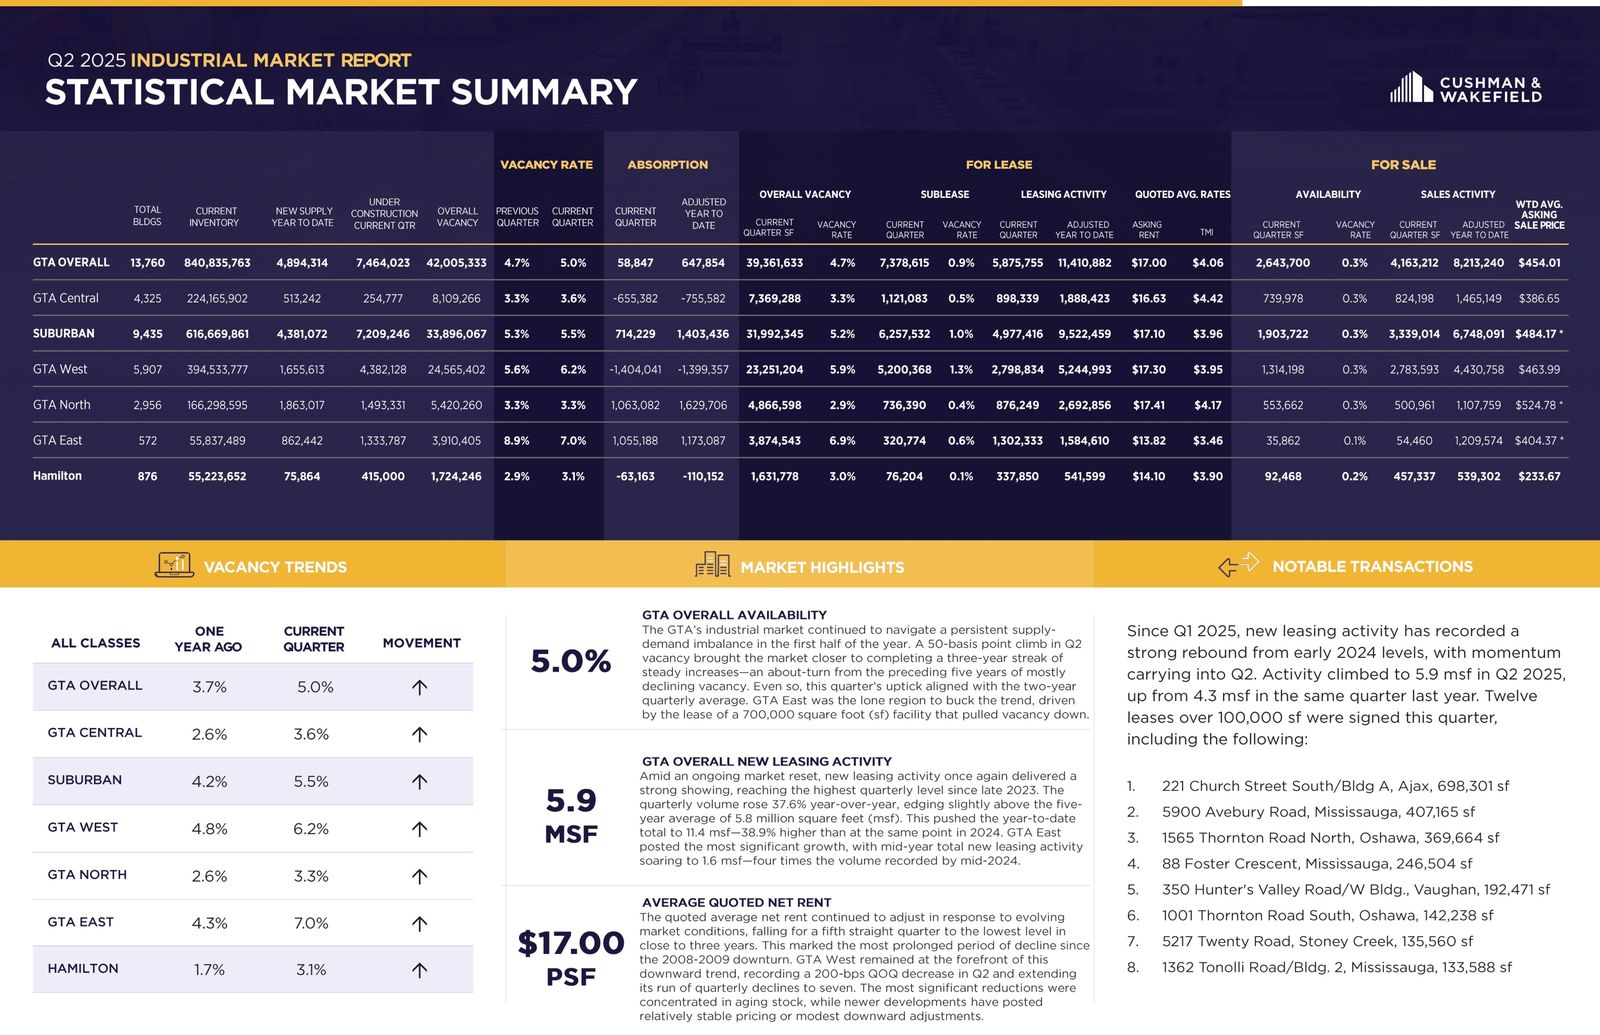
- The availability rate increased from 5.6% to 6.2%, with 5.9% available for lease and 0.3% available for sale;
- We had 1,655,613 SF of new supply year-to-date and 4,382,128 SF still under construction;
- We had 1,404,041 SF of negative absorption;
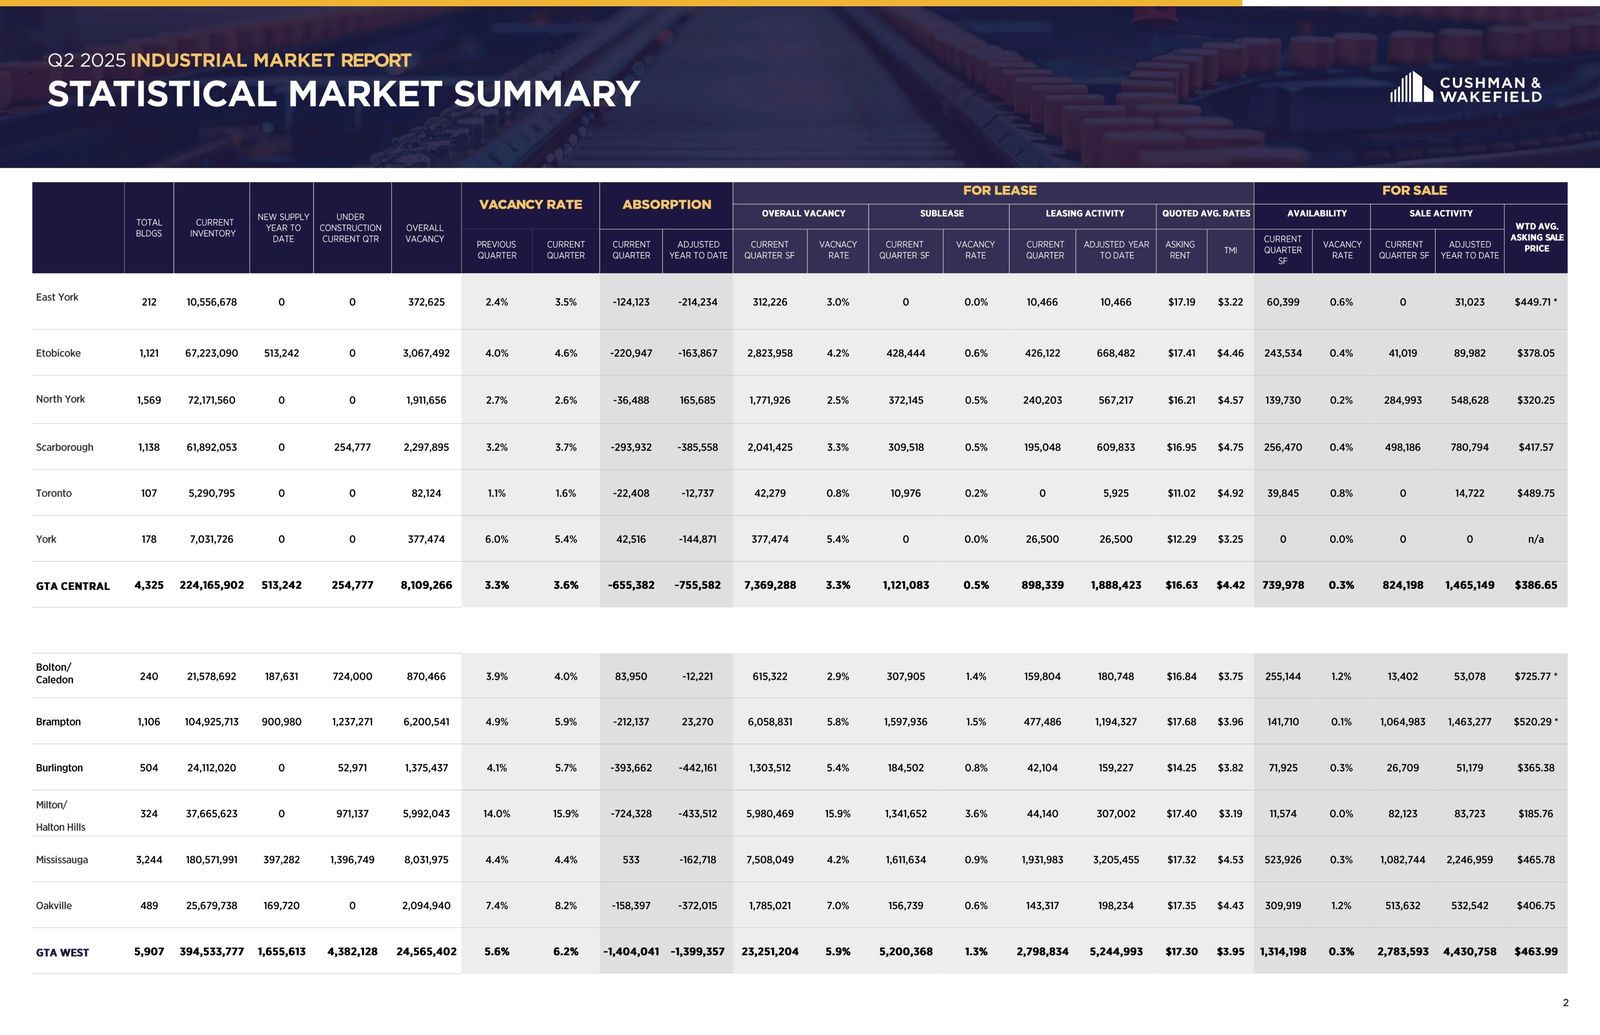
- Brampton achieved the highest weighted asking net rental rates in Q2 2025 at $17.68 PSF, followed by Milton/Halton Hills at $17.40 PSF and Oakville at $17.35 PSF;
- The weighted average asking net rent was $17.30 PSF, down from $17.65 the previous quarter, with additional rent of $3.95 PSF (a slight decrease from $3.96 PSF); and
- The weighted average asking sale price rose from $441.50 PSF to $463.99 PSF; with values largely determined by industrial condo sales.
Why are the GTA West Markets in such demand?
The GTA West Industrial Markets are by far the largest industrial markets in the GTA, representing about 47% of GTA Industrial Inventory, or 394,533,777 SF. The GTA West Markets were active this quarter and with more than 4,382,128 SF under construction.
So, if you are an Investor, Landlord, or Owner-Occupier you may be wondering…
“How much is my property really worth?”
What rental rate can I expect? How much $/PSF would I be able to get if I sold my building?
These questions are being asked all the time.
The answer to this will depend on a range of factors, including:
- the age and size of the building,
- lot size,
- ceiling height,
- office component,
- parking,
- trucking access,
- truck parking if available, etc….
This week we are covering the Toronto-West Markets
(Mississauga, Brampton, Oakville, Milton, Caledon, Burlington & Halton Hills)
Statistical Summary – GTA West Markets – Q2 2025
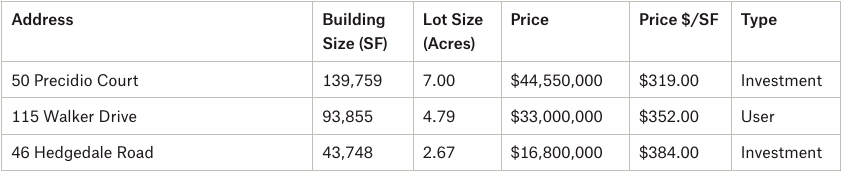
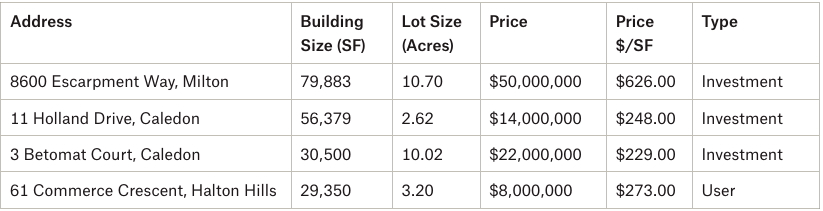
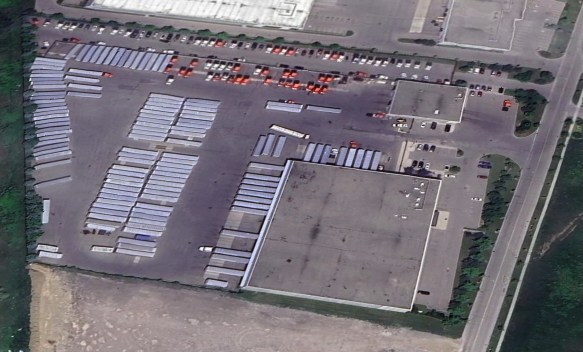
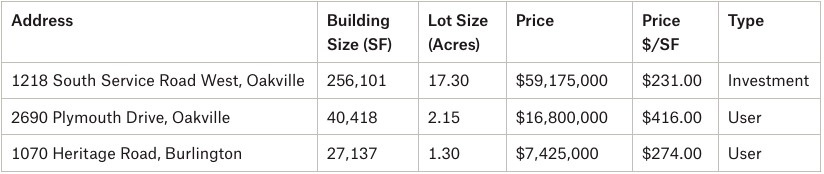
Properties Sold between April 2025 – June 2025, from 20,000 SF plus
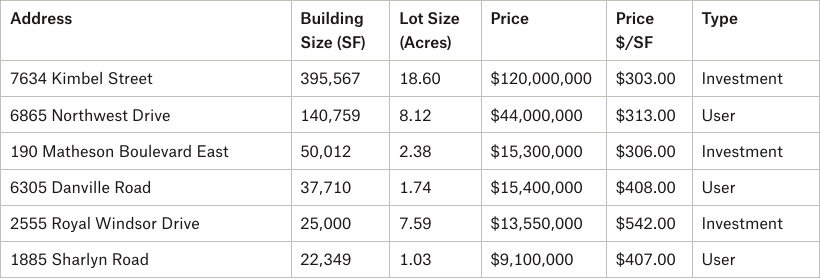
190 Matheson Boulevard East, Mississauga.
Properties Leased between April 2025 – June 2025, from 20,000 SF plus
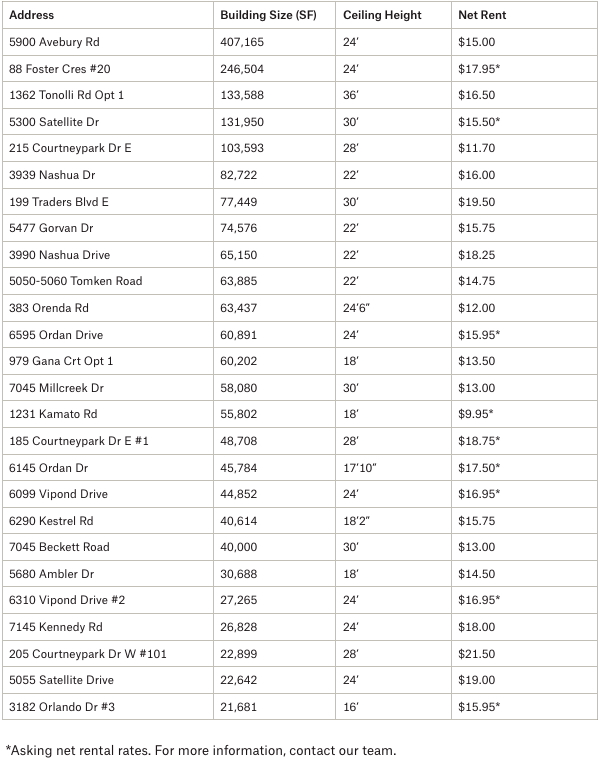
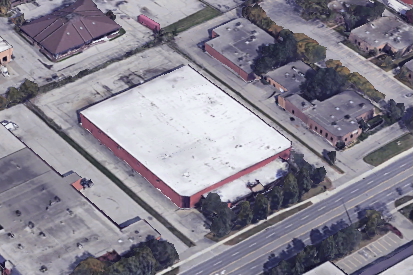
5900 Avebury Rd, Mississauga.
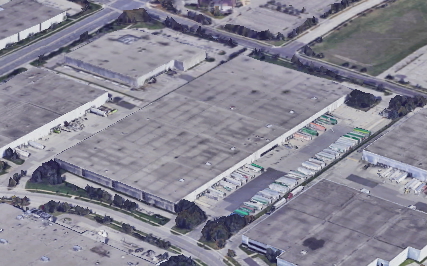
50 Precidio Court, Brampton.
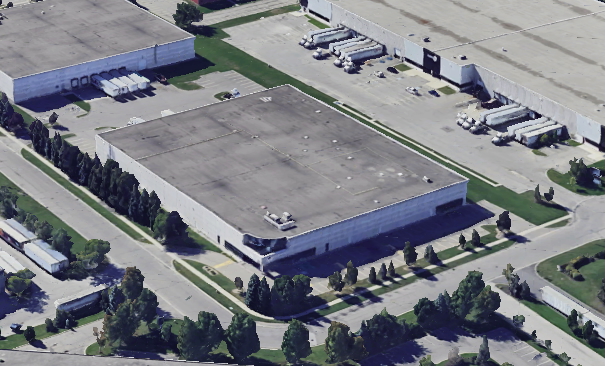
Properties Leased between April 2025 – June 2025, from 20,000 SF plus
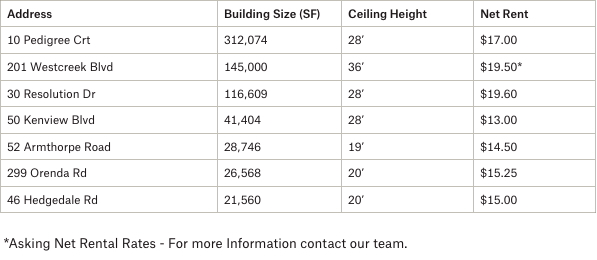
10 Pedigree Crt, Brampton.
8600 Escarpment Way, Milton.
1218 South Service Road West, Oakville.
GTA West Markets (Milton/Halton Hills/Oakville/Caledon)
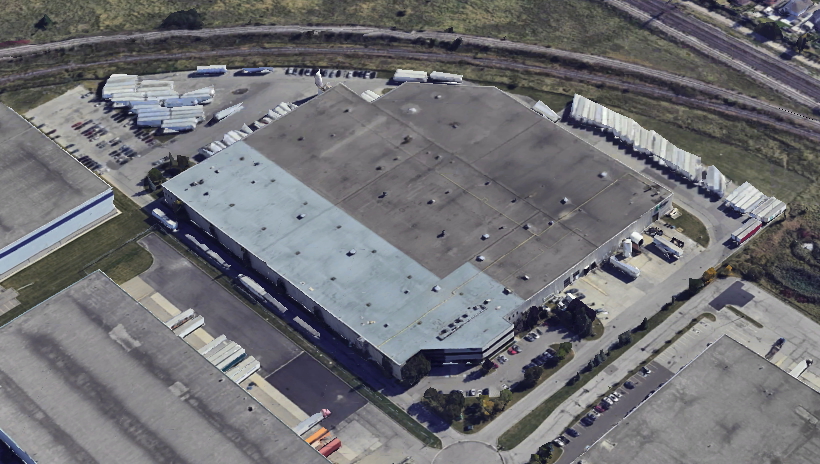
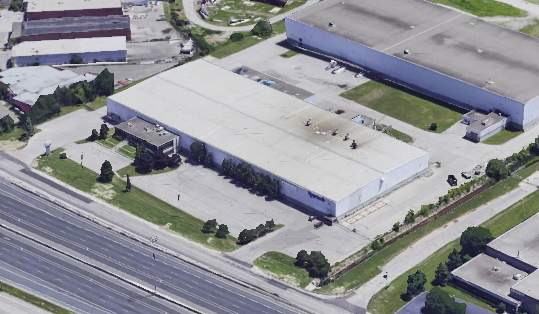
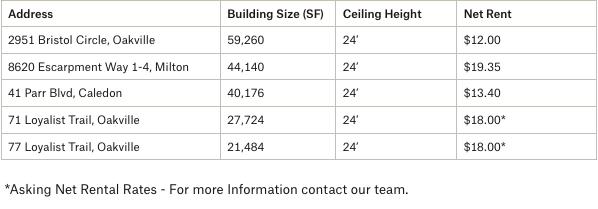
Properties Leased between April 2025 – June 2025, from 20,000 SF plus
2951 Bristol Circle, Oakville.
- Rental Rates: Rents continue to adjust and, in many cases, we continue to see rate reductions. We expect this to continue. Likewise, annual rental escalations have plateaued and have decreased. Leasing is picking up and businesses are making decisions, however, the ongoing threat of tariffs are a concern. Further, there is continued downward pressure on rents, specifically in Class B or C industrial buildings. Overall, we are in a more balanced market between Landlords and Tenants.
- Property Values: As rental rates plateau, and as we see rents decrease in certain properties, we are going to see a decrease in value of investment properties. The recent and continued interest rate cuts may stabilize this trend, however. For users, we expect to see values remain elevated as supply of properties for sale is extremely limited. Finally, and despite the downward trend of interest rates, previously elevated levels have decreased the value of development land.
- Development Opportunities: In the second quarter of 2025, we had approximately 4.38 million square feet under construction in the GTA-West markets. This represents about 59% of all new development across the GTA (7.46 million SF), with the bulk of activity taking place in Mississauga (1.39 MSF) and Brampton (1.24 MSF).
Conclusion:
So, how much is your property really worth?
What rental rate can you expect or how much per SF would you be able to get if you sell your building? How much can we compress CAP rates to create even greater value?
Well, the answers to these questions will depend on a variety of factors, many of which we can quickly uncover in an assessment of your situation. And with our rental rates and valuations at all-time highs, and vacancy rates low, finding the right property is a real challenge.
Having said that, a lot of transactions are being done off the market.. and to participate in that, you should connect with experienced brokers that have long-standing relationships with property owners.
For a confidential consultation or a complimentary opinion of value of your property please give us a call.
Until next week…
Goran Brelih and his team have been servicing Investors and Occupiers of Industrial properties in Toronto Central and Toronto North markets for the past 30 years.
Goran Brelih is an Executive Vice President for Cushman & Wakefield ULC in the Greater Toronto Area.
Over the past 30 years, he has been involved in the lease or sale of approximately 25.7 million square feet of industrial space, valued in excess of $1.6 billion dollars while averaging between 40 and 50 transactions per year and achieving the highest level of sales, from the President’s Round Table to Top Ten in GTA and the National Top Ten.
Specialties:
Industrial Real Estate Sales and Leasing, Investment Sales, Design-Build and Land Development
About Cushman & Wakefield ULC.
Cushman & Wakefield (NYSE: CWK) is a leading global real estate services firm that delivers exceptional value for real estate occupiers and owners. Cushman & Wakefield is among the largest real estate services firms with approximately 53,000 employees in 400 offices and 60 countries.
In 2020, the firm had revenue of $7.8 billion across core services of property, facilities and project management, leasing, capital markets, valuation and other services. To learn more, visit www.cushmanwakefield.com.
For more information on GTA Industrial Real Estate Market or to discuss how they can assist you with your real estate needs please contact Goran at 416-756-5456, email at goran.brelih@cushwake.com, or visit www.goranbrelih.com.
Connect with Me Here! – Goran Brelih’s Linkedin Profile: https://ca.linkedin.com/in/goranbrelih
Goran Brelih, SIOR
Executive Vice President, Broker
Cushman & Wakefield ULC, Brokerage.
www.cushmanwakefield.com
Office: 416-756-5456
Mobile: 416-458-4264
Mail: goran.brelih@cushwake.com
Website: www.goranbrelih.com