
January 26th, 2024
“Constraints drive innovation and force focus. Instead of trying to remove them, use them to your advantage.”
- 37Signals
As we reflect and follow along the broad narratives surrounding the industrial real estate market, it’s easy to pinpoint the various constraints, as we will outline below in a somewhat linear but non-exhaustive manner.
Thread #1: Economic shutdowns created a boom in logistics and trucking thanks to e-commerce sales, resulting in higher absorption and fewer availabilities of industrial space.
Thread #2: Economic shutdowns created a labour shortage, resulting in many issues; one of which saw manufacturers generally producing less raw, fabricated, and processed materials.
Thread #3: Investors moved to bring new industrial properties to market, however, delayed permitting and approvals, along with difficulties in securing materials and labour, exacerbated the supply-side shock, creating more competition amongst tenants for space – and amongst developers for suitable lands.
Thread #4: Rents and values skyrocket in the short- and medium-term as those who need product now have to pay a premium to secure it.
Thread #5: Strong demand, low interest rates, and explosive growth in valuations and business sales fuel an expansion of development pipeline and companies’ needs for warehousing.
Thread #6: Construction begins en-masse. Pre-leasing deals are cut 12 to 24 months out. Many occupiers wait for deliveries as the economy rages on.
Thread #7: Input costs rise. First energy, then materials, then wages. Operating costs balloon, margins shrink. Cost-cutting begins entering the conversation. Contracts are lost. Those who were over-extended begin to feel the squeeze.
Thread #8: Fears of inflation spiraling out of control begin the ascent of interest rates and signal the beginning of tighter monetary policy.
Thread #9: Investment sales plummet. Tenants renewing at double or triple their previous rates are swallowing a bitter pill, but options are still extremely limited. Creative solutions are employed.
Thread #10: Deals become harder to complete. Financing becomes more challenging. Growth plans are put on hold. Layoffs and downsizing become more prevalent. Outlooks dim.
Thread #11: A flood of new deliveries coupled with negative absorption bring more available space to market. Rents and values stabilize; softening further for older or obsolete product. The market moves towards a new equilibrium. Changing expectations have reached the majority. Opportunity still abounds, but it is less opportunistic.
>You Are Here<.
While you, dear Reader, may read the above and think all is lost, nothing could be further from the truth.
As mentioned, opportunity does still abound, however, it is more strategic and dependent on the preparation of the Parties involved. Now that interest rates have likely stabilized – and rents and values have followed suit – we begin to see predictability. Now that vacancies have seen an uptick, we see options. And as things take longer to come to fruition, we see more collaboration and purposefulness in transactions.
The fact remains that rents have more than tripled in the past decade and that we are at less than half the purported ‘healthy market availability rate.’ However, only the grizzled veterans may remember operating in less-than-ideal economic conditions and with interest rates above 4%. Population growth remains strong, and Ontario is making a massive push towards manufacturing independence, sustainability, and innovation.
The constraints are evident. Yet the future is bright.
With that said, let’s examine how each of the Greater Toronto Area regions performed in Q4 2023, and where we expect the market to go moving forward.
- The availability rate increased from 1.2% to 1.9%, with a lease availability rate of 1.8% and a sale availability rate of 0.1%;
- We had 1,952,367 SF of new supply and 2,549,228 SF still under construction;
- We had negative absorption of 106,594 SF;
- The weighted average asking net rent was $18.92 PSF, up from $18.81 PSF the previous quarter, with additional rent of $4.35 PSF (a decrease from $4.71 PSF); and
- The weighted average asking sale price decreased from $552.64 PSF to $538.03.
Why are the GTA North Markets in such demand?
Generally, the Toronto-North markets have newer product with higher ceiling heights and better shipping access. Further, there are benefits from access to major transportation routes.
So, if you are an Investor, Landlord, or Owner-Occupier you may be wondering…
“How much is my property really worth?”
What rental rate can I expect? How much $/PSF would I be able to get if I sold my building?
These questions are being asked all the time.
The answer to this will depend on a range of factors, including:
- the age and size of the building,
- lot size,
- ceiling height,
- office component,
- parking,
- trucking access,
- truck parking if available, etc….
This week we are covering the Toronto North Markets (Vaughan, Markham, Richmond Hill, Aurora, Newmarket)
Statistical Summary – GTA North Markets – Q4 2023
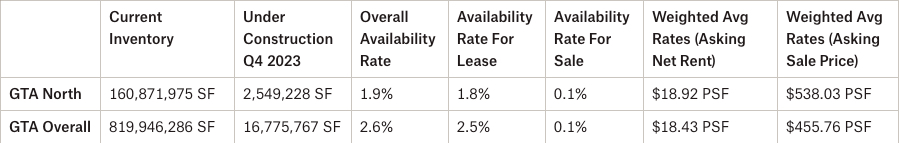

Q4 2023 GTA Industrial Market Overview – Source: Cushman & Wakefield

Q4 2023 Industrial Market Overview – Source: Cushman & Wakefield
GTA North Markets (Vaughan)

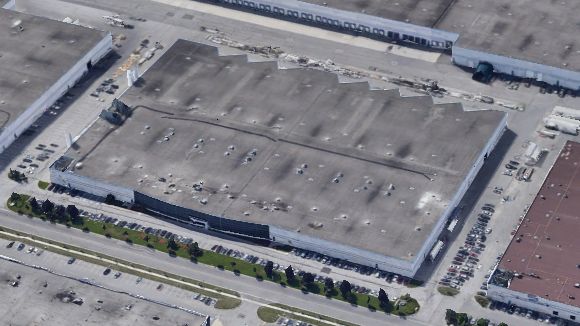
30 Royal Group Crescent, Vaughan.


336 Courtland Avenue, Vaughan.
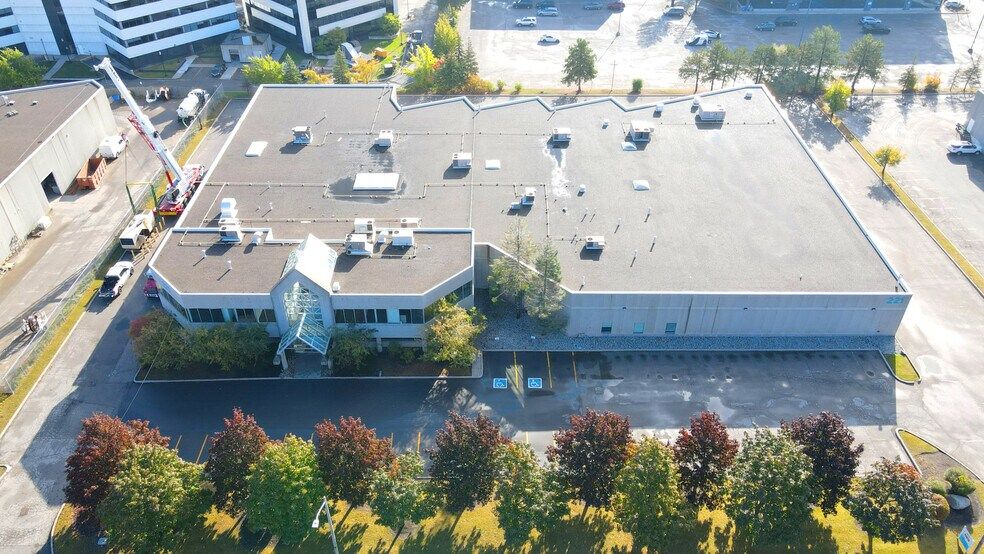
221 Whitehall Drive, Markham.

125 Mary Street, Aurora.
- Rental Rates: The Toronto-North markets now have a weighted average rental rate of $18.92 PSF net, the second-highest across the GTA regions (behind the GTA West at $19.12 PSF). That said, rents have levelled off and, in some cases, we have seen rate reductions. We expect this to continue. Likewise, annual rental escalations have plateaued and may decrease. Leasing is slower and it is taking longer to complete a deal as Tenants have become more cautious. Finally, as vacancies increase and we see negative absorption, Tenants are beginning to have options, which may spur more movement and breed competition, putting more downward pressure on rents, specifically in Class B or C industrial buildings. Overall, we are heading towards a more balanced market between Landlords and Tenants.
- Property Values: The Toronto-North markets have the highest weighted-average asking sale price across the GTA at $538.03 PSF, due to the lack of availabilities and cost to construct. However, as rental rates plateau, and as we see rents decrease in certain properties, coupled with upward pressure on cap rates, we are going to see a decrease in the value of investment properties. For users, even though the Buyer pool may have thinned due to increased interest rates, we expect to see values remain elevated as supply is extremely limited. Finally, due to the aforementioned interest rates, the value of development land has decreased.
- Development Opportunities: The Toronto-North markets still have quite a bit of land available for development in Vaughan-West along Highway 50. We are also going to see further development along Highway 400 – such as the 1.7MSF King-Jane Business Park – as land sites in more central areas become more scarce.
So, how much is your property really worth?
What rental rate can you expect or how much per SF would you be able to get if you sell your building? How much can we compress CAP rates to create even greater value?
Well, the answers to these questions will depend on a variety of factors, many of which we can quickly uncover in an assessment of your situation. And with our rental rates and valuations at all-time highs, and vacancy rates low, finding the right property is a real challenge.
Having said that, a lot of transactions are being done off the market.. and to participate in that, you should connect with experienced brokers that have long-standing relationships with property owners.
For a confidential consultation or a complimentary opinion of value of your property please give us a call.
Until next week…
Goran Brelih and his team have been servicing Investors and Occupiers of Industrial properties in Toronto Central and Toronto North markets for the past 30 years.
Goran Brelih is an Executive Vice President for Cushman & Wakefield ULC in the Greater Toronto Area.
Over the past 30 years, he has been involved in the lease or sale of approximately 25.7 million square feet of industrial space, valued in excess of $1.6 billion dollars while averaging between 40 and 50 transactions per year and achieving the highest level of sales, from the President’s Round Table to Top Ten in GTA and the National Top Ten.
Specialties:
Industrial Real Estate Sales and Leasing, Investment Sales, Design-Build and Land Development
About Cushman & Wakefield ULC.
Cushman & Wakefield (NYSE: CWK) is a leading global real estate services firm that delivers exceptional value for real estate occupiers and owners. Cushman & Wakefield is among the largest real estate services firms with approximately 53,000 employees in 400 offices and 60 countries.
In 2020, the firm had revenue of $7.8 billion across core services of property, facilities and project management, leasing, capital markets, valuation and other services. To learn more, visit www.cushmanwakefield.com.
For more information on GTA Industrial Real Estate Market or to discuss how they can assist you with your real estate needs please contact Goran at 416-756-5456, email at goran.brelih@cushwake.com, or visit www.goranbrelih.com.
Connect with Me Here! – Goran Brelih’s Linkedin Profile: https://ca.linkedin.com/in/goranbrelih
Executive Vice President, Broker
Cushman & Wakefield ULC, Brokerage.
www.cushmanwakefield.com
Office: 416-756-5456
Mobile: 416-458-4264
Mail: goran.brelih@cushwake.com
Website: www.goranbrelih.com