
Q1 2021 Insight, Toronto-North Markets
Establishing True Valuations Across Differing Markets
April 23rd, 2021
Spring is finally upon us, and despite the sunny outlook and promising signs of global recovery, the Greater Toronto Area is still dealing with the aftermath of a dark winter. Specifically, we have found ourselves in yet another lockdown. Only this time around, all non-essential goods at retailers such as WalMart, Sam’s Club, and Costco have been blocked off, forcing consumers to purchase all of their non-food or medical-related items online.
While this may not seem like much… and while it may not be a huge inconvenience to us as customers of these establishments… this small policy change may have increased household online order volume by a factor of two or three, overnight. Where we once delivered a full carload of supplies home, a sizeable portion must now be picked off warehouse shelving elsewhere (essentially, duplicate inventory) and shipped via freight, LTL truck, or last-mile delivery vans.
Multiply this effect over millions of households in Southern Ontario and you get an even further strained supply chain and logistics network.
So what does this mean in the context of the industrial market?
Well, for a market that was already at sub-2% availabilities for 11 straight months, it means the competition for industrial space will only increase.
Retailers hoping for everything to re-open by May or June might finally be convinced that an e-commerce pivot (or add-on) is necessary to survive. Grocery delivery services are naturally blossoming and eating up dry and cold storage space. And 3PLs are swallowing up inventories at a torrid pace while maturing and diversifying their services with flexible offerings such as ‘warehousing on-demand.’
And so, we find ourselves back where we seem to always be.
New sectors and applications for industrial bolstering demand… And still no answer to the issue of a chronic lack of space.
Key Takeaways from Q1 2021
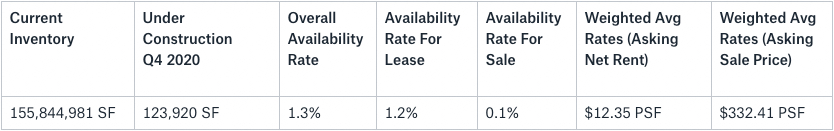
- The availability Rate increased slightly from 1% to 1.3%, with a lease availability rate of 1.2% and a sale availability rate of 0.1%;
- We had 123,920 SF of construction completed, with 2,997,018 SF still under construction;
- We had an absorption of 527,800 SF;
- The weighted average asking net rent increased from $10.85 to $12.35 PSF with additional rent of $4.04 PSF; and the
- Weighted average asking sale price was $332.41 PSF.
Why are the GTA North Markets in such demand?
Generally, the Toronto-North markets have newer product with higher ceiling heights and better shipping access. Further, there are benefits from access to major transportation routes.
So, if you are an Investor, Landlord, or Owner-Occupier you may be wondering…
“How much is my property really worth?”
What rental rate can I expect? How much $/PSF would I be able to get if I sold my building?
These questions are being asked all the time.
The answer to this will depend on a range of factors, including:
- the age and size of the building,
- lot size,
- ceiling height,
- office component,
- parking,
- trucking access,
- truck parking if available, etc….
In order to get to the truth, we need to dig a bit deeper…
This week we are covering the Toronto-North Markets (Vaughan, Markham, Richmond Hill, Newmarket & Aurora)
Statistical Summary – GTA North Markets – Q1 2021
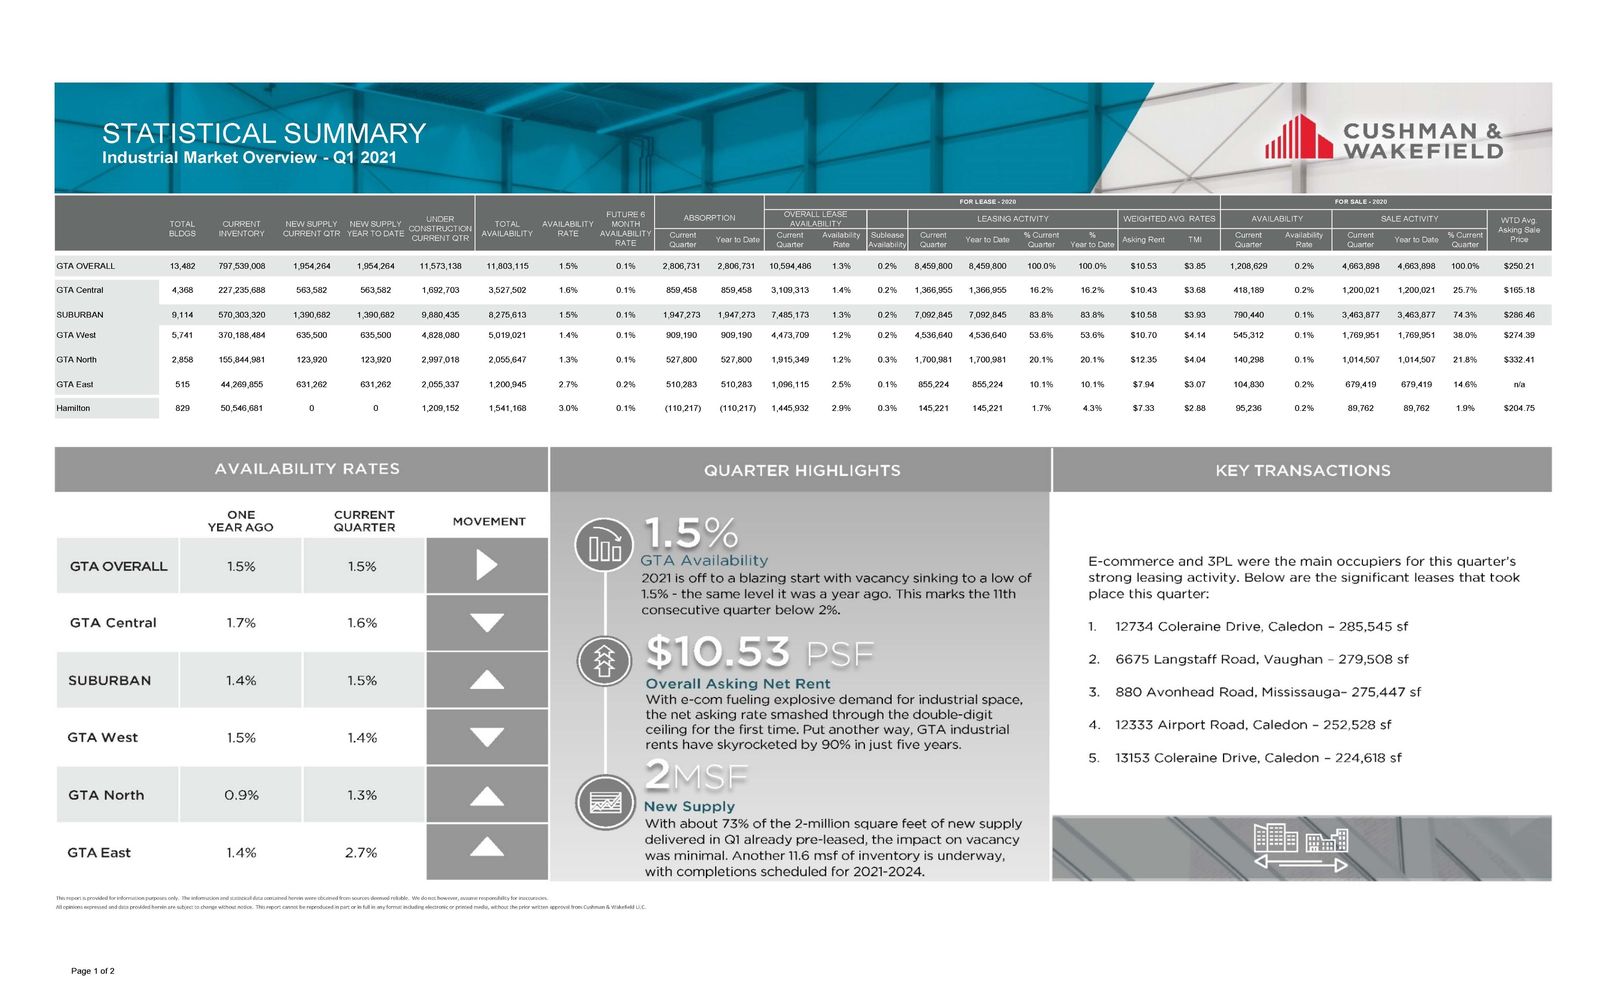
Q1 2021 GTA Industrial Market Overview – Source: Cushman & Wakefield ULC
So let’s take a closer look at how the different Toronto North Markets performed this quarter…
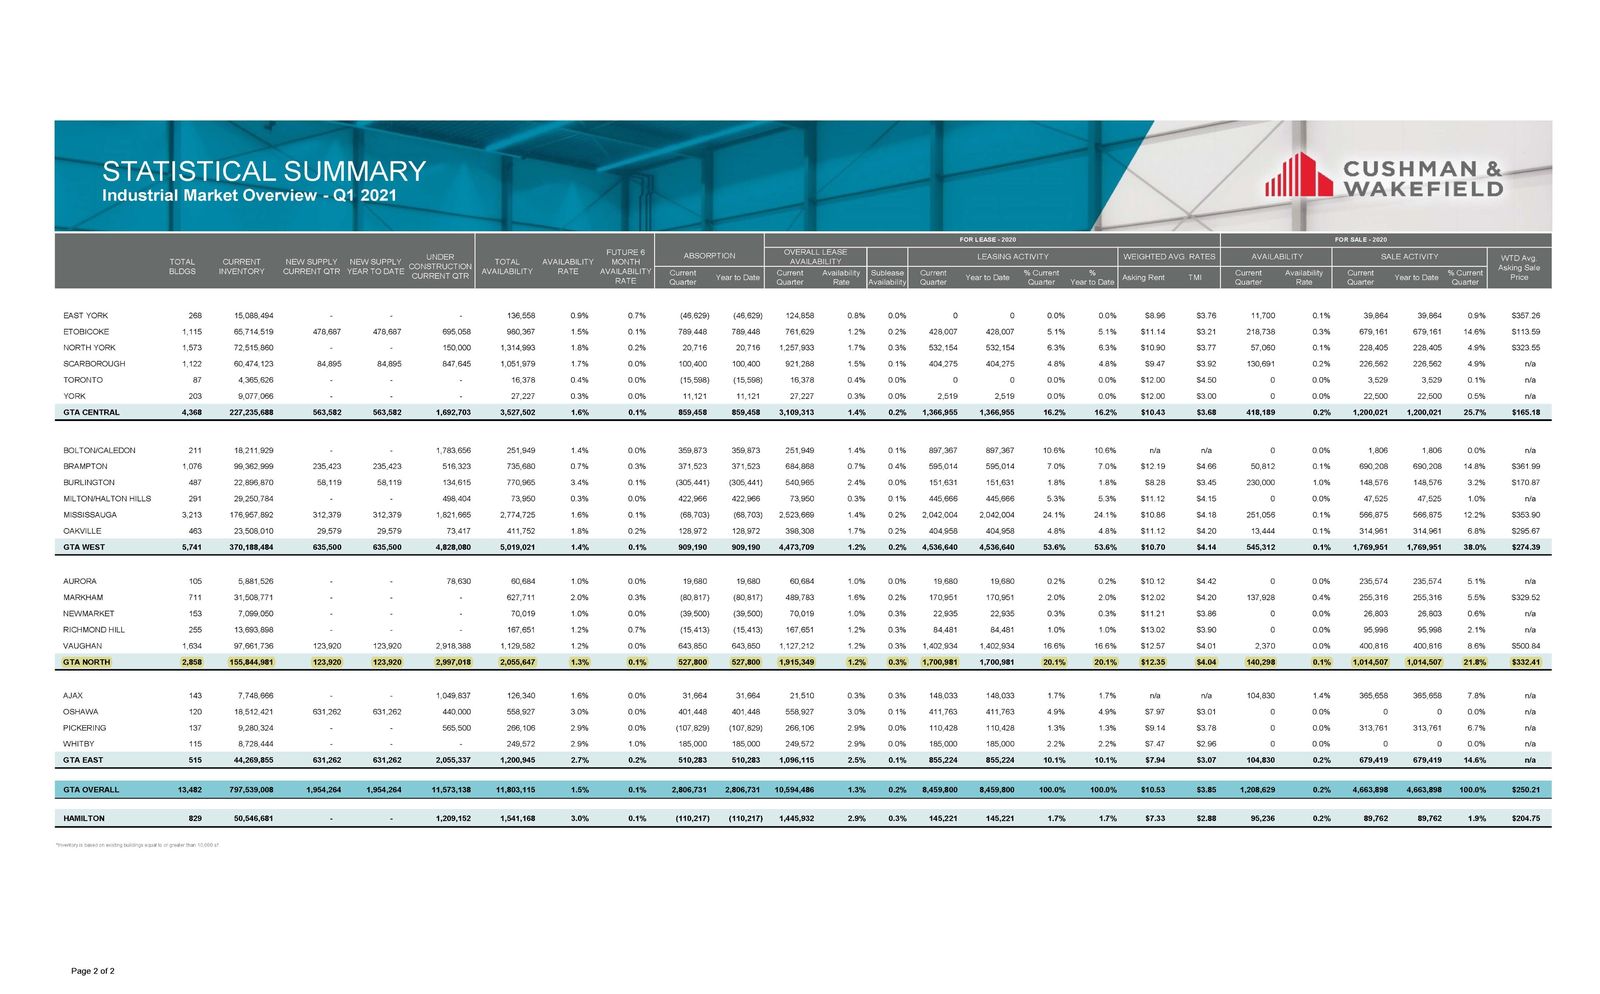
GTA North Markets (Vaughan)
Properties Sold between January 2021 – March 2021, from 20,000 SF plus

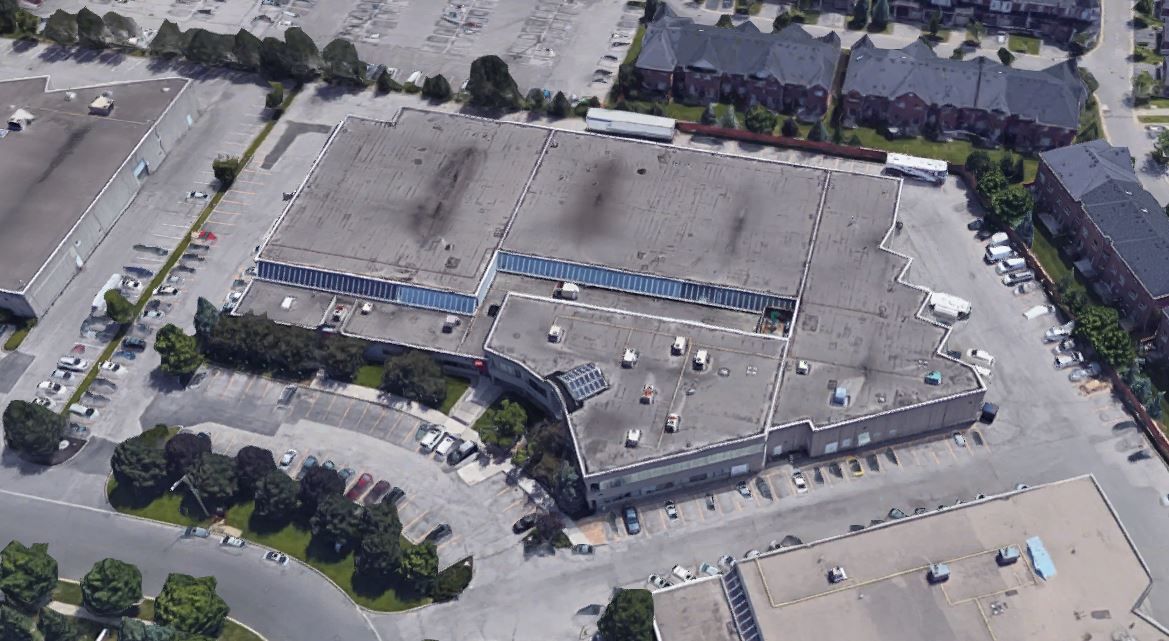
4220 Steeles Avenue West, Vaughan
GTA North Markets (Vaughan)
Properties Leased between January 2021 – March 2021, from 20,000 SF – 50,000 SF
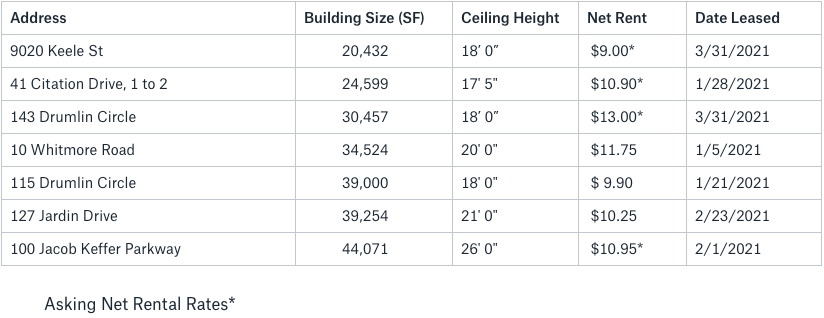
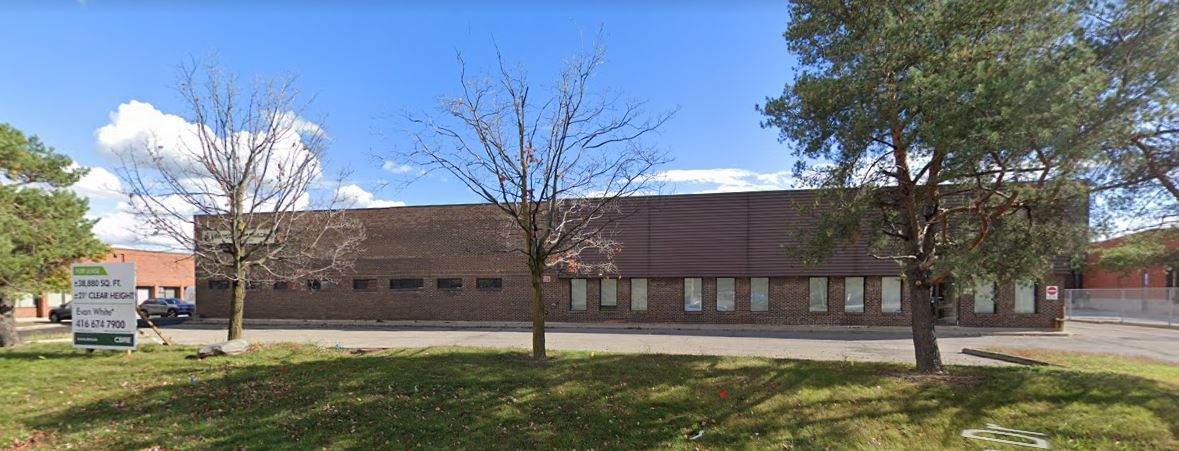
127 Jardin Drive, Vaughan
Properties Leased between January 2021 – March 2021, from 50,000 SF – 100,000 SF
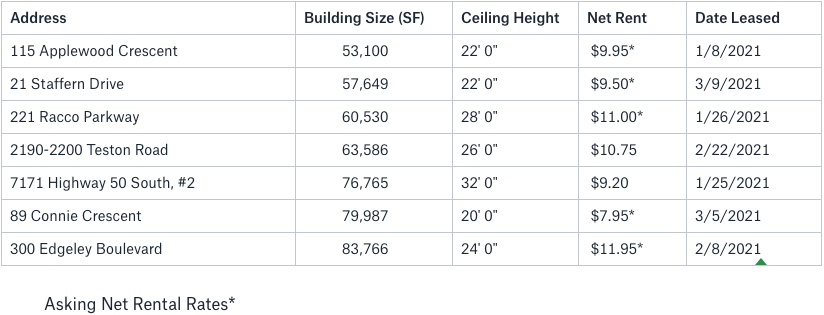
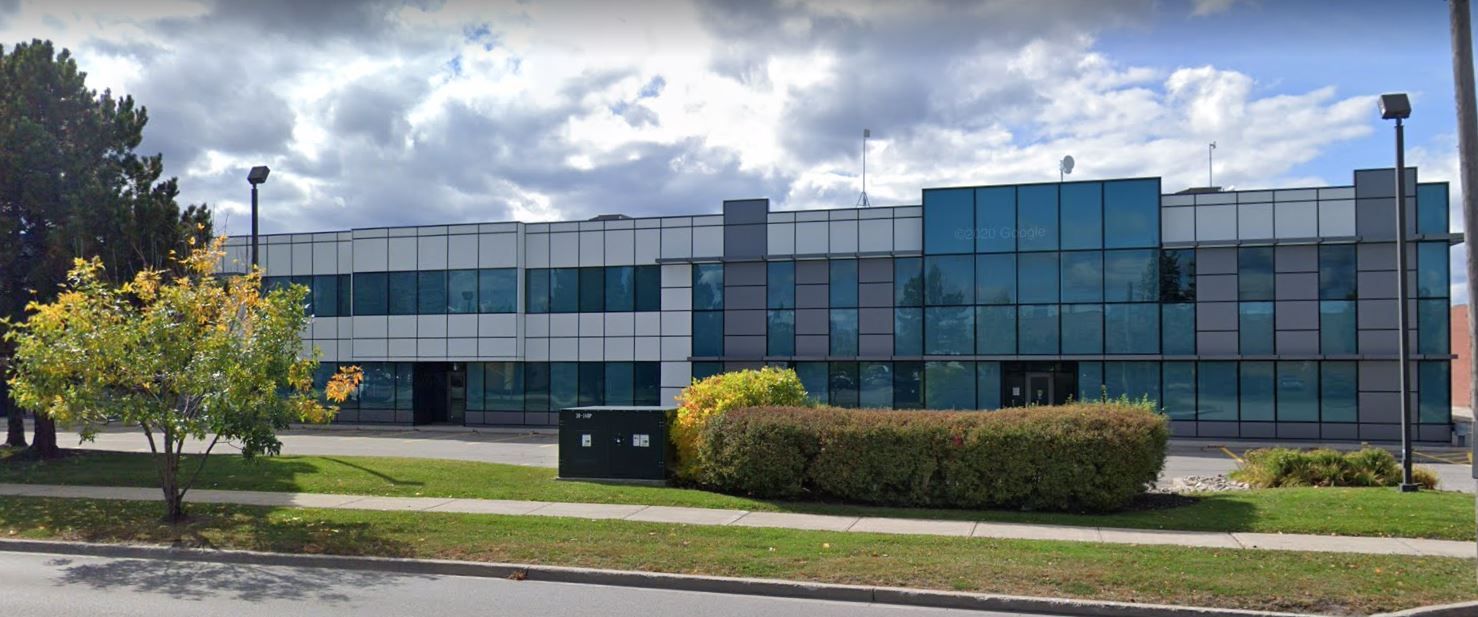
300 Edgeley Boulevard, Vaughan
Properties Leased between January 2021 – March 2021, from 100,000 SF plus
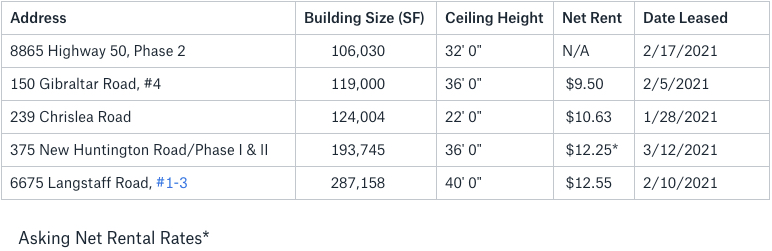
6675 Langstaff Road Vaughan
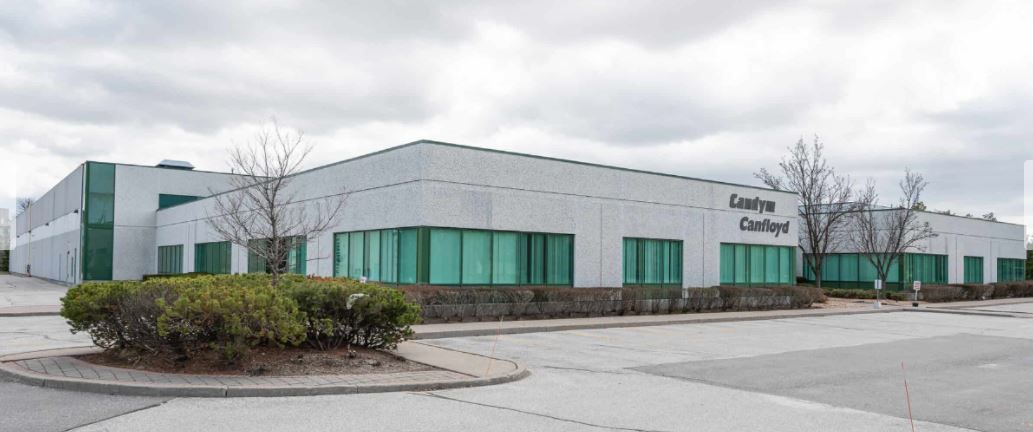
GTA North Markets (Markham)
Properties Sold between January 2021 – March 2021, from 20,000 SF plus

201 Whitehall Drive, Markham
Properties Leased between January 2021 – March 2021, from 20,000 SF plus
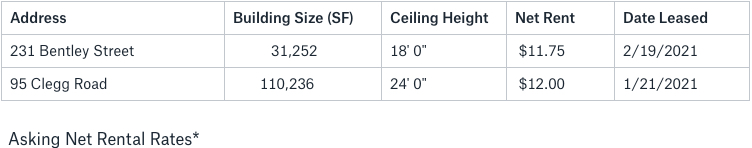
95 Clegg Road, Markham
GTA North Markets (Richmond Hill)
Properties Sold between October 2020 – December 2020, from 20,000 SF plus
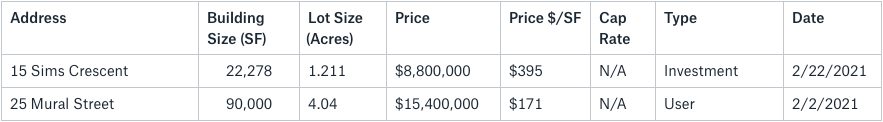
25 Mural Street, Richmond Hill
GTA North Markets (Richmond Hill)
Properties Leased between October 2020 – December 2020, from 20,000 SF plus

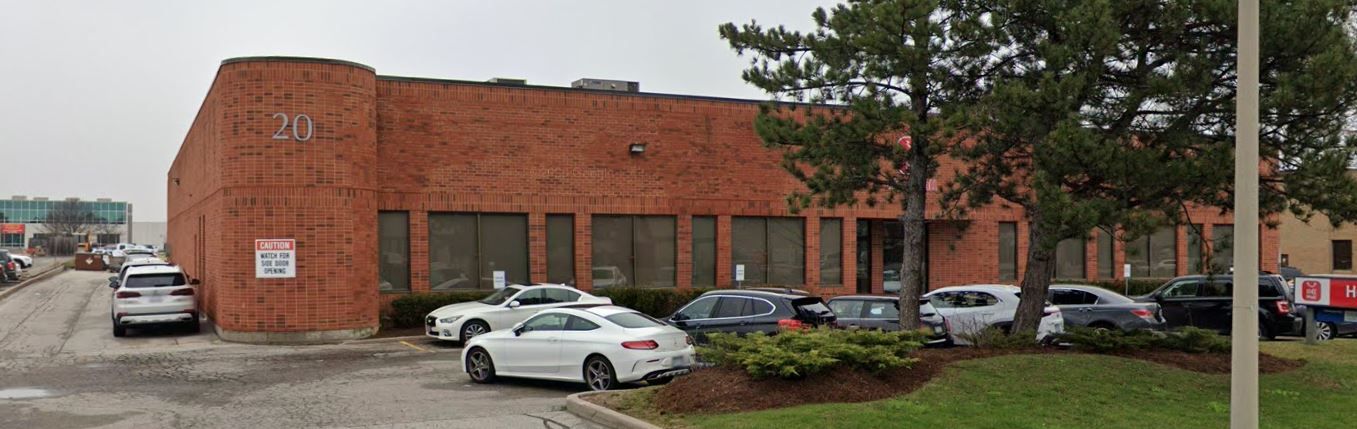
20 East Wilmot Street, Richmond Hill
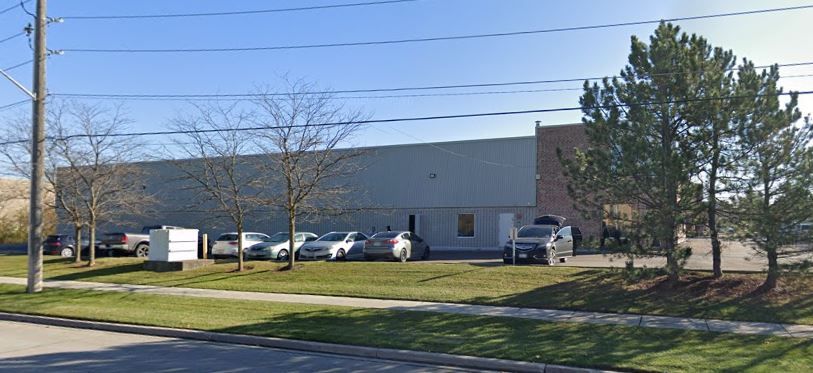
GTA North Markets (Aurora/Newmarket)
Properties Sold between October 2020 – December 2020, from 20,000 SF plus
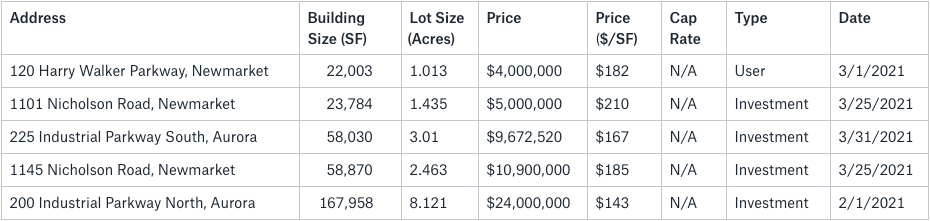

200 Industrial Parkway North, Aurora
GTA North Markets (Aurora/Newmarket)
Properties Leased between October 2020 – December 2020, from 20,000 SF plus
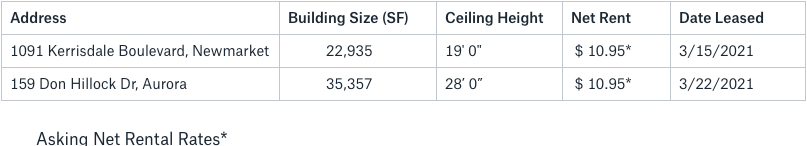
1091 Kerrisdale Boulevard, Newmarket
- Rental Rates: The Toronto-North markets continue to have the highest weighted average rental rates at $12.35 PSF, followed by the West markets at $10.70 PSF and Central markets at $10.43 PSF. Keep in mind that rental rates are also subject to annual escalations. We have seen a further increase in net rental rates across the board further into double-digit territory, depending on a number of factors, such as building size, location, ceiling height, etc. Based on the increase of value of industrial land, infill sites, construction costs, etc… we can only see these rates continue to grow. Overall, we are still in a Landlord’s market.
- Property Values: The Toronto-North markets have the highest weighted average asking sale price in the GTA at $332.41 PSF followed by the West markets at $274.39 PSF. It really depends on the building size and location. CAP rates are still somewhere between 4.5% to 4.75% but it really depends on the rental rates in place. If we have older rental rates with immediate growth potential, then CAP rates could end up below 4%.
- Development Opportunities: The Toronto-North markets still have quite a bit of land available for development in Vaughan-West along Highway 50. We are also going to see further development along Highway 400 as land sites in more central areas become more scarce. Regarding industrial land, pricing generally continues to increase.
Conclusion:
So, how much is your property really worth?
What rental rate can you expect or how much per SF would you be able to get if you sell your building? How much can we compress CAP rates to create even greater value?
Well, the answers to these questions will depend on a variety of factors, many of which we can quickly uncover in an assessment of your situation. And with our rental rates and valuations at all-time highs, and vacancy rates low, finding the right property is a real challenge.
Having said that, a lot of transactions are being done off the market.. and to participate in that, you should connect with experienced brokers that have long-standing relationships with property owners.
For a confidential consultation or a complimentary opinion of value of your property please give us a call.
Until next week…
Goran Brelih and his team have been servicing Investors and Occupiers of Industrial properties in Toronto Central and Toronto North markets for the past 25 years.
Goran Brelih is a Senior Vice President for Cushman & Wakefield ULC in the Greater Toronto Area.
Over the past 27 years, he has been involved in the lease or sale of approximately 25.7 million square feet of industrial space, valued in excess of $1.6 billion dollars while averaging between 40 and 50 transactions per year and achieving the highest level of sales, from the President’s Round Table to Top Ten in GTA and the National Top Ten.
Goran is currently serving as Immediate Past President of the SIOR ‐ Society of Industrial and Office Realtors, Central Canadian Chapter.
Specialties:
Industrial Real Estate Sales and Leasing, Investment Sales, Design-Build and Land Development
About Cushman & Wakefield ULC.
Cushman & Wakefield is a leading global real estate services firm that delivers exceptional value by putting ideas into action for real estate occupiers and owners. Cushman & Wakefield is among the largest real estate services firms with 48,000 employees in approximately 400 offices and 70 countries.
In 2017, the firm had revenue of $6.9 billion across core services of property, facilities and project management, leasing, capital markets, advisory, and other services. To learn more, visit www.cushmanwakefield.com or follow @CushWake on Twitter.
For more information on GTA Industrial Real Estate Market or to discuss how they can assist you with your real estate needs please contact Goran at 416-756-5456, email at goran.brelih@cushwake.com, or visit www.goranbrelih.com.
Connect with Me Here! – Goran Brelih’s Linkedin Profile: https://ca.linkedin.com/in/goranbrelih
Goran Brelih, SIOR
Senior Vice President, Broker
Cushman & Wakefield ULC, Brokerage.
www.cushmanwakefield.com
Immediate Past President, SIOR – Central Canada Chapter
www.siorccc.org
Office: 416-756-5456
Mobile: 416-458-4264
Mail: goran.brelih@cushwake.com
Website: www.goranbrelih.com