Q1 2021 Insight, Toronto-West Markets
Establishing True Valuations Across Differing Markets
May 7th, 2021
Spring is finally upon us, and despite the sunny outlook and promising signs of global recovery, the Greater Toronto Area is still dealing with the aftermath of a dark winter. Specifically, we have found ourselves in yet another lockdown. Only this time around, all non-essential goods at retailers such as WalMart and Costco have been blocked off, forcing consumers to purchase all of their non-food or medical-related items online.
While this may not seem like much… and while it may not be a huge inconvenience to us as customers of these establishments… this small policy change may have increased household online order volume by a factor of two or three, overnight. Where we once delivered a full carload of supplies home, a sizeable portion must now be picked off warehouse shelving elsewhere (essentially, duplicate inventory) and shipped via freight, LTL truck, or last-mile delivery vans.
Multiply this effect over millions of households in Southern Ontario and you get an even further strained supply chain and logistics network.
So what does this mean in the context of the industrial market?
Well, for a market that was already at sub-2% availabilities for 11 straight months, it means the competition for industrial space will only increase.
Retailers hoping for everything to re-open by May or June might finally be convinced that an e-commerce pivot (or add-on) is necessary to survive. Grocery delivery services are naturally blossoming and eating up dry and cold storage space. And 3PLs are swallowing up inventories at a torrid pace while maturing and diversifying their services with flexible offerings such as ‘warehousing on-demand.’
And so, we find ourselves back where we seem to always be.
New sectors and applications for industrial bolstering demand… And still no answer to the issue of a chronic lack of space.
Key Takeaways from Q1 2021
- The overall availability rate in the GTA-West Markets in Q1 2021 is 1.4%, down from 1.6% in Q4 2020;
- Currently, there is about 4,828,000 SF under construction in the GTA-West Markets;
- The GTA West markets delivered 635,000 SF of new space to the market in Q1 2021;
- Absorption in Q1 2021 was 909,000 SF;
- The City of Brampton achieved the highest net rental rates in Q1 2021 at $12.19 PSF, followed by City of Oakville and Milton/Halton Hills with $11.12 PSF;
- Availability rate across GTA is 1.5%, down from 1.7% in Q4 2020, while the weighted average net rental rates in GTA West markets reached $10.53 per SF up from $10.46 per SF in Q4 2020; while the weighted average sale price in the West markets was $274.39 per SF, up from $253.48 per SF in Q4 2020 and $247.62 per SF in Q3 2020.
Why are the GTA West Markets in such demand?
The GTA West Industrial Markets are by far the largest industrial markets in the GTA, representing about 45% of GTA Industrial Inventory, or about 370,000,000 SF. The GTA West Markets were very active this quarter, with more than 4,828,000 SF under construction and a flurry of lease and sale transactions completed.
So, if you are an Investor, Landlord, or Owner-Occupier you may be wondering…
“How much is my property really worth?”
What rental rate can I expect? How much $/PSF would I be able to get if I sold my building?
These questions are being asked all the time.
The answer to this will depend on a range of factors, including:
- the age and size of the building,
- lot size,
- ceiling height,
- office component,
- parking,
- trucking access,
- truck parking if available, etc….
In order to get to the truth, we need to dig a bit deeper…
This week we are covering the Toronto-West Markets (Mississauga, Brampton, Oakville, Milton, Caledon, Burlington & Halton Hills)
Statistical Summary – GTA West Industrial Market – Q1 2021


Q1 2021 GTA Industrial Market Statistical Summary – Source: Cushman & Wakefield ULC
So let’s take a closer look at how the Toronto West Markets performed during Q1 2021…
GTA West Markets (Mississauga)
Properties Sold between January 2021 – March 2021, from 20,000 SF plus


6660 Kennedy Road, Mississauga
GTA West Markets (Mississauga)
Properties Leased between January 2021 – March 2021, from 20,000 SF – 50,000 SF

On the leasing side, a total of 22 properties were leased between 20,000 – 50,000 SF. The net rental rates achieved were from $7.65 PSF – $10.95 PSF, with an average building size of 33,506 SF and an average net rental rate of $9.91 PSF.

6789 Millcreek Drive, Mississauga
GTA West Markets (Mississauga)
Properties Leased between January 2021 – March 2021, from 50,000 SF – 100,000 SF

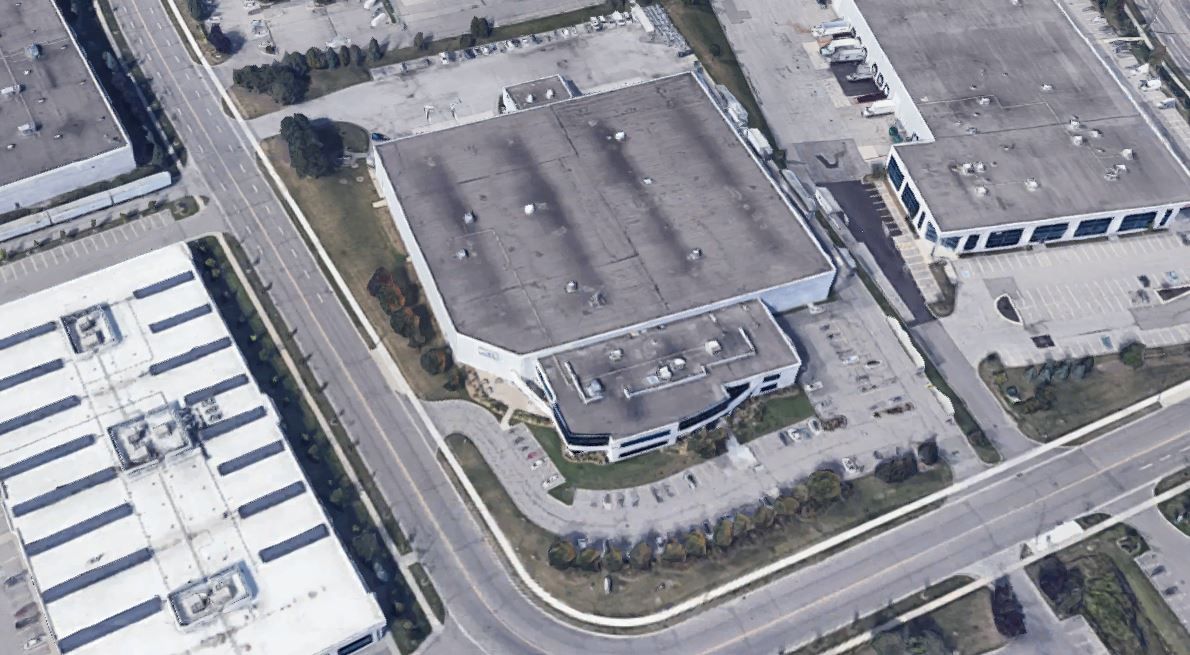
6701 Financial Drive , Mississauga
GTA West Markets (Mississauga)
Properties Leased between January 2021 – March 2021, from 100,000 SF plus


7381 Bramalea Road , Mississauga

A total of 8 properties were sold in Brampton. The prices achieved were in the range of $187PSF – $381 PSF, with an average building size of 140,967SF and an average price of $260 PSF.
GTA West Markets (Brampton)
Properties Leased between January 2021 – March 2021, from 20,000 SF – 50,000 SF
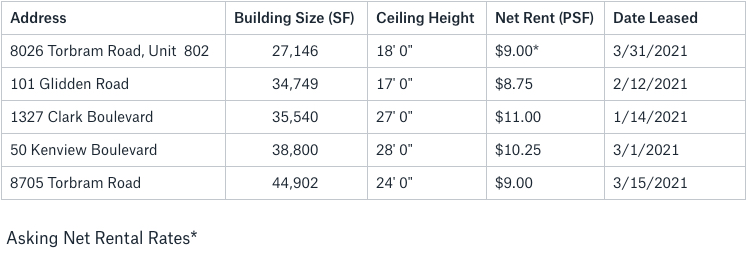

8705 Torbram Road, Brampton
GTA West Markets (Brampton)
Properties Leased between January 2021 – March 2021, from 50,000 SF – 100,000 SF


75 Bramalea Road, Brampton
GTA West Markets (Brampton)
Properties Leased between January 2021 – March 2021, from 100,000 SF plus


200 Chrysler Drive, Brampton
GTA West Markets (Burlington)
Properties Sold between January 2021 – March 2021, from 20,000 SF plus

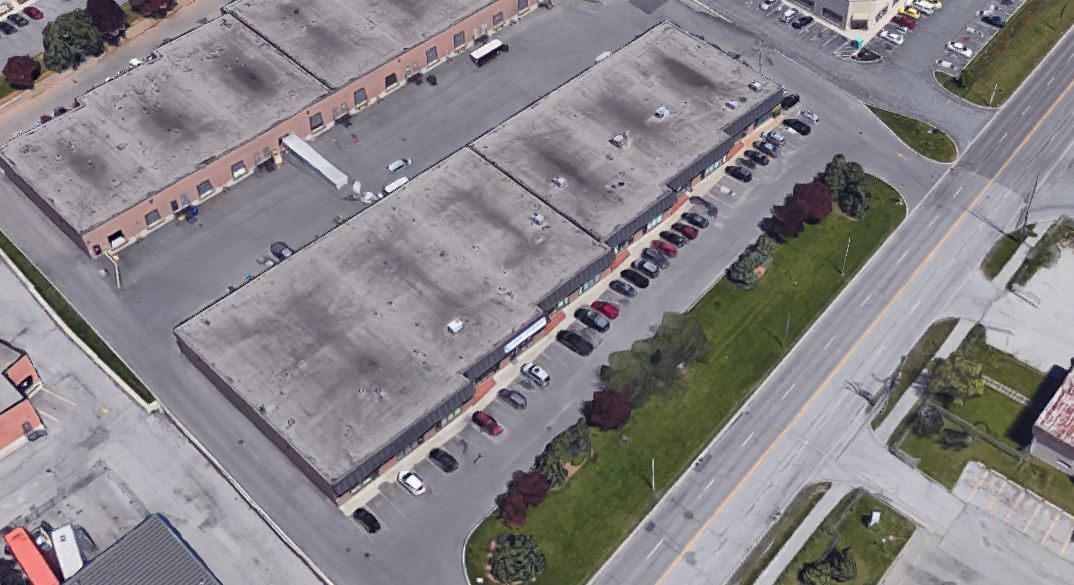
5109 Harvester Road, Burlington
GTA West Markets (Burlington)
Properties Leased between January 2021 – March 2021, from 20,000 SF plus


1022 Champlain Avenue, Burlington
GTA West Markets (Milton)
Properties Sold between January 2021 – March 2021, from 20,000 SF – 50,000 SF

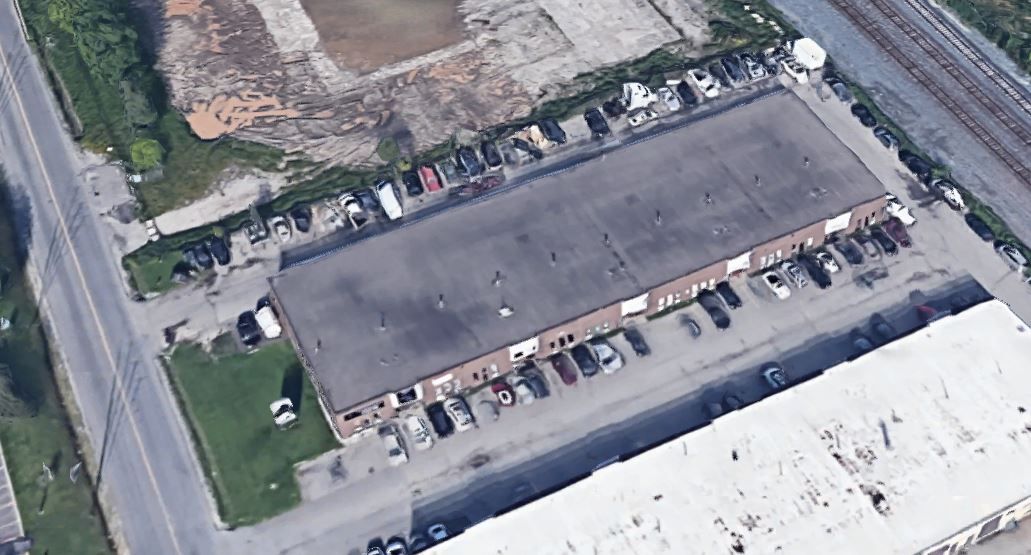
145-151 Nipissing Road, Milton
GTA West Markets (Milton)
Properties Leased between January 2021 – March 2021, from 20,000 SF plus

In Milton, a total of 4 properties were leased in Q1 2021 from 20,000 SF plus. The net rental rates achieved were from $7.08 – $9.50 PSF, with an average building size of 108,599 SF and an average net rental rate of $8.26 PSF.

95 Market Drive, Milton
GTA West Markets (Oakville)
Properties Sold between January 2021 – March 2021, from 20,000 SF plus

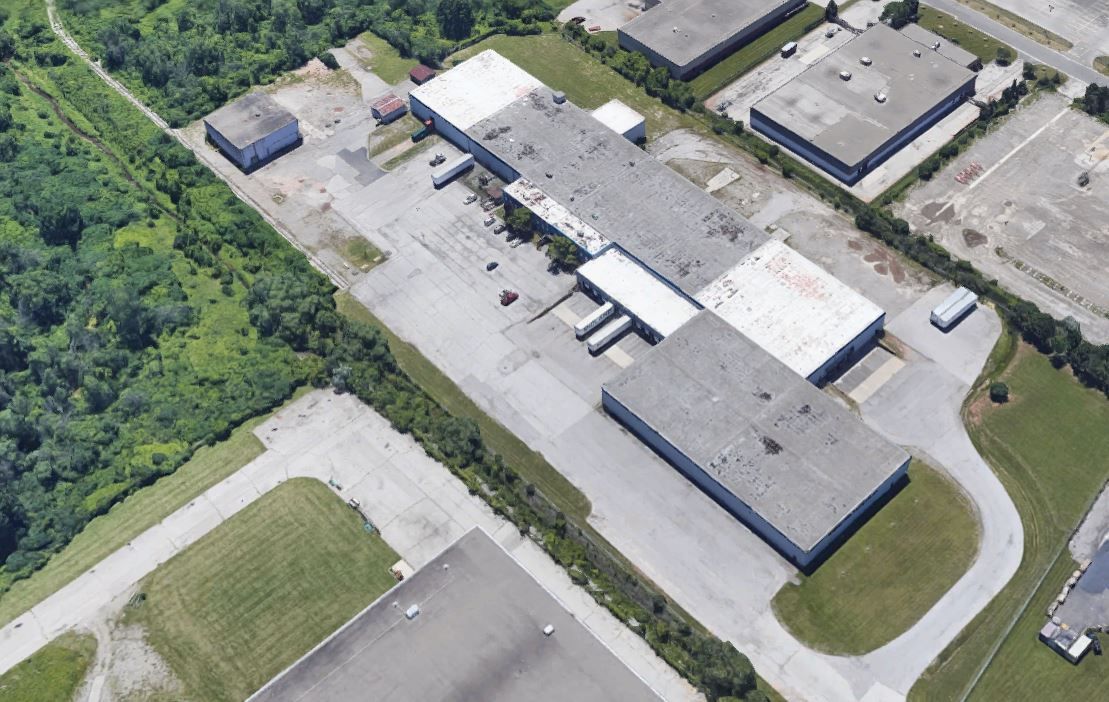
1290 South Service Road West, Oakville
GTA West Markets (Oakville)
Properties Leased between January 2021 – March 2021, from 20,000 SF plus


2905 Bristol Circle, Oakville
GTA West Markets (Caledon)
Properties Sold between January 2021 – March 2021, from 20,000 SF plus
No properties were sold in Caledon in Q1 2021.
GTA West Markets (Caledon)
Properties Leased between January 2021 – March 2021, from 20,000 SF plus

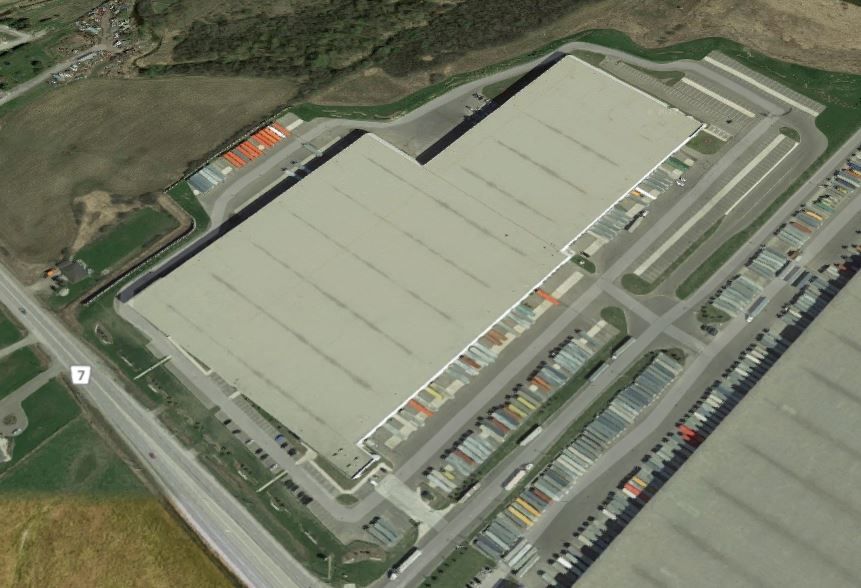
12333 Airport Road, Caledon
What Lies Ahead:
- Rental Rates: We see many transactions achieving in excess of $10 PSF net. We are also hearing that some of the current developments are increasing their price guidance to above $12 PSF net. That trend will continue.
- Property Values: With Brampton’s weighted average asking sale price at $361.99 PSF and Mississauga’s at $353.90… these submarkets lead the GTA-West markets. And with a sale availability rate of 0.1%, prices will appreciate further.
- Development Opportunities: In the first quarter of 2021, we had over 4.8 million square feet under construction in the GTA-West markets. This represents 41% of all new development across the GTA (11.8 million SF), making this the most active region by far. This comes as no surprise as the West markets have the most land available for development.
Conclusion:
So, how much is your property really worth?
What rental rate can you expect or how much per SF would you be able to get if you sell your building? How much can we compress CAP rates to create even greater value?
Well, the answers to these questions will depend on a variety of factors, many of which we can quickly uncover in an assessment of your situation. And with our rental rates and valuations at all-time highs, and vacancy rates low, finding the right property is a real challenge.
Having said that, a lot of transactions are being done off the market.. and to participate in that, you should connect with experienced brokers that have long-standing relationships with property owners.
For a confidential consultation or a complimentary opinion of value of your property please give us a call.
Until next week…
Goran Brelih and his team have been servicing Investors and Occupiers of Industrial properties in Toronto Central and Toronto North markets for the past 25 years.
Goran Brelih is a Senior Vice President for Cushman & Wakefield ULC in the Greater Toronto Area.
Over the past 27 years, he has been involved in the lease or sale of approximately 25.7 million square feet of industrial space, valued in excess of $1.6 billion dollars while averaging between 40 and 50 transactions per year and achieving the highest level of sales, from the President’s Round Table to Top Ten in GTA and the National Top Ten.
Goran is currently serving as Immediate Past President of the SIOR ‐ Society of Industrial and Office Realtors, Central Canadian Chapter.
Specialties:
Industrial Real Estate Sales and Leasing, Investment Sales, Design-Build and Land Development
About Cushman & Wakefield ULC.
Cushman & Wakefield is a leading global real estate services firm that delivers exceptional value by putting ideas into action for real estate occupiers and owners. Cushman & Wakefield is among the largest real estate services firms with 48,000 employees in approximately 400 offices and 70 countries.
In 2017, the firm had revenue of $6.9 billion across core services of property, facilities and project management, leasing, capital markets, advisory, and other services. To learn more, visit www.cushmanwakefield.com or follow @CushWake on Twitter.
For more information on GTA Industrial Real Estate Market or to discuss how they can assist you with your real estate needs please contact Goran at 416-756-5456, email at goran.brelih@cushwake.com, or visit www.goranbrelih.com.
Connect with Me Here! – Goran Brelih’s Linkedin Profile: https://ca.linkedin.com/in/goranbrelih
Goran Brelih, SIOR
Senior Vice President, Broker
Cushman & Wakefield ULC, Brokerage.
www.cushmanwakefield.com
Immediate Past President, SIOR – Central Canada Chapter
www.siorccc.org
Office: 416-756-5456
Mobile: 416-458-4264
Mail: goran.brelih@cushwake.com
Website: www.goranbrelih.com


