
Q2 2023 Insight, Toronto-North Markets
Establishing True Valuations Across Differing Markets
July 28th, 2023
Simplified models are a useful tool when studying complex systems such as a national or global economy.
If you’ve ever picked up a business journal, tuned in to a news segment, or studied the dry tomes of academia, you’ve likely encountered these supply/demand charts, IS-LM curves, or even production possibility frontiers.
While they often rely on a laundry-list of assumptions and do not always account for nuances or exceptions to the rule, they are useful in that we they can help boil down numerous interdependent variables into a simple “do this, then that happens” framework.
Why this is important is because we typically do not have the time, data, or computational power to make the perfect decision each and every time, nor would we want to allocate such attention to more trivial matters. Most of the time, an approximate and definitive decision that translates into action is more useful to us than paralysis by analysis.
Looking to the broader industrial market, there are a number of key metrics which we observe to try to accurately describe and to then predict what may occur in the future. Both aid us in, ultimately, making better decisions to help bolster our investment portfolios or business operations.
That said, the Greater Toronto industrial market likes to surprise us insofar that “do this, then that happens,” doesn’t always happen.
Rising interest rates, a wave of new inventory, significant negative absorption, and cooling inflation should see a reversion in rents and values. And although both of these primary indicators have begun to stabilize, there remains tremendous inherent value in industrial assets.
Demand is high, particularly for well-located, modern, functional space. And a similar appetite, coupled with higher replacement costs have kept values elevated despite a continued uptick in borrowing costs.
Will we ever see a noticeable decrease in rents or values? Will availabilities ever climb above 2%?
Apart from the cyclical ebb and flow of the economy, we don’t foresee any major changes anytime soon, however, only time will tell.
What is in our control is to stay on the pulse of the market through high-level data, street-level intel, and an ongoing flow of conversations with stakeholders.
So with that said, let’s examine how each of the Greater Toronto Area regions performed in Q2 2023, and where we expect the market to go moving forward.
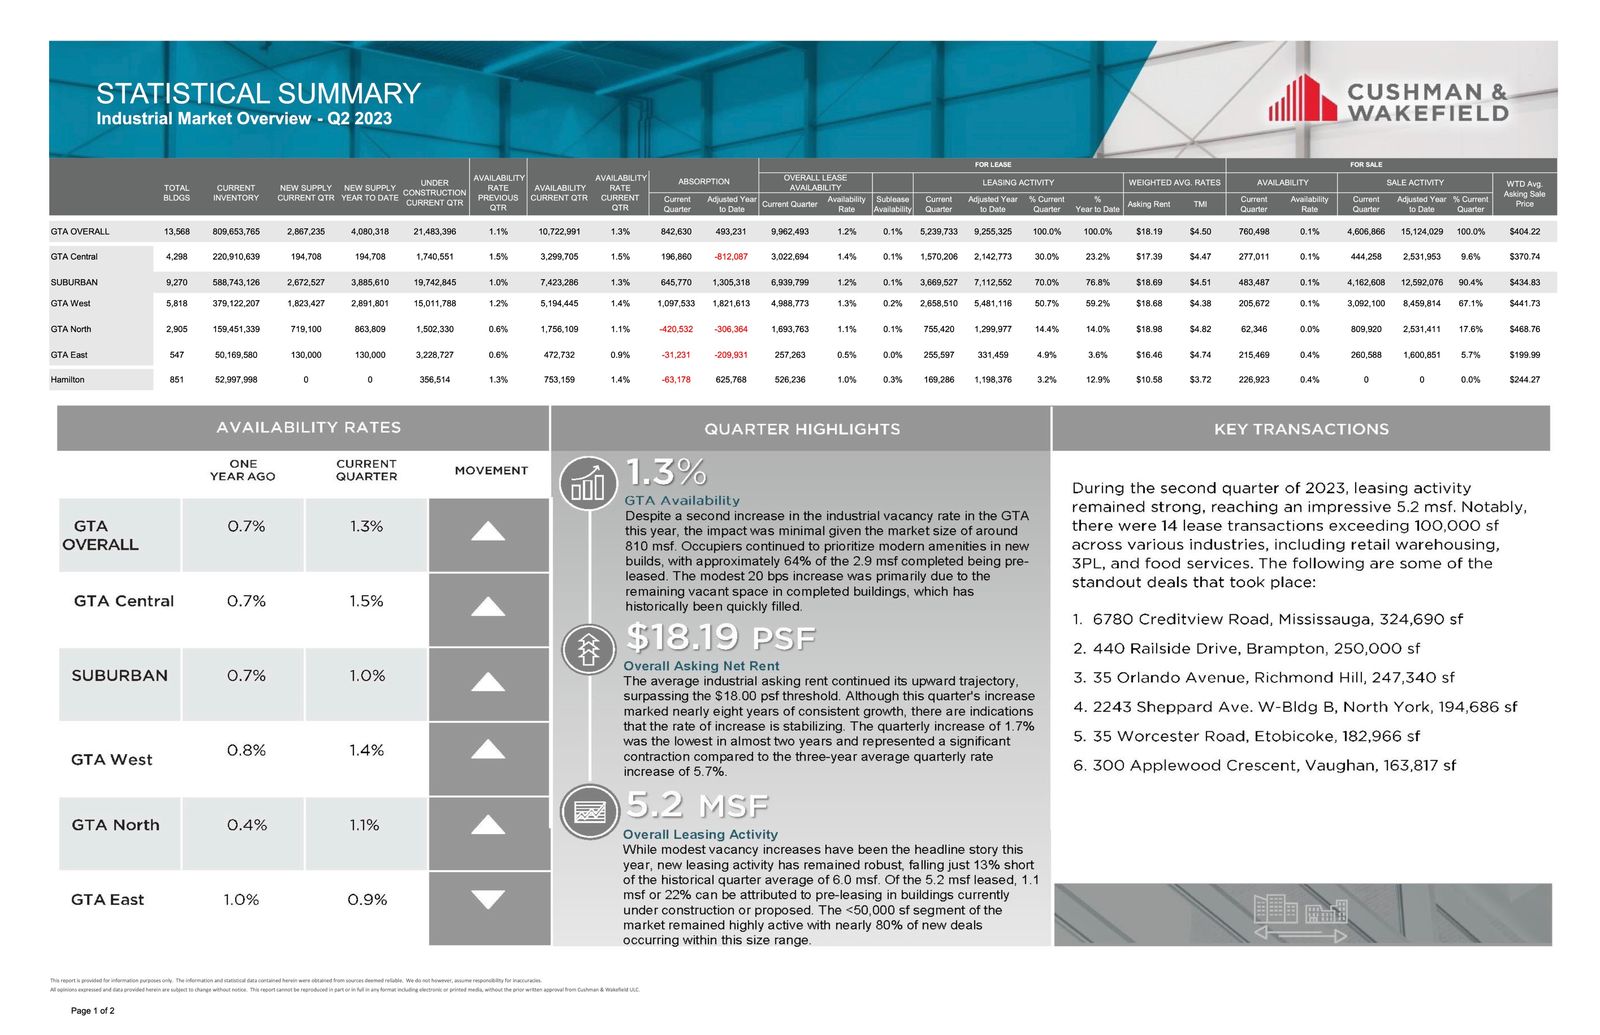
- The availability rate increased from 0.6% to 1.1%, with a lease availability rate of 1.1% and a sale availability rate close to 0% (62,346 SF out of 159M SF of inventory);
- We had 719,100 SF of new supply and 1,502,330 SF still under construction;
- We had negative absorption of 420,532 SF;
- The weighted average asking net rent was $18.98 PSF, up slightly from $18.27 the previous quarter, with additional rent of $4.82 PSF (an increase from $4.41 PSF); and
- The weighted average asking sale price decreased from $513.07 PSF to $468.76 PSF.
Why are the GTA North Markets in such demand?
Generally, the Toronto-North markets have newer product with higher ceiling heights and better shipping access. Further, there are benefits from access to major transportation routes.
So, if you are an Investor, Landlord, or Owner-Occupier you may be wondering…
“How much is my property really worth?”
What rental rate can I expect? How much $/PSF would I be able to get if I sold my building?
These questions are being asked all the time.
The answer to this will depend on a range of factors, including:
- the age and size of the building,
- lot size,
- ceiling height,
- office component,
- parking,
- trucking access,
- truck parking if available, etc….
This week we are covering the Toronto North Markets (Vaughan, Markham, Richmond Hill, Aurora, Newmarket, Stouffville, East Gwillimbury)
Statistical Summary – GTA North Markets – Q2 2023

Q2 2023 GTA Industrial Market Overview – Source: Cushman & Wakefield

Q2 2023 Industrial Market Overview – Source: Cushman & Wakefield
GTA North Markets (Vaughan)


45 Di Poce Way, Vaughan

300 Applewood Crescent, Vaughan
2600 John Street, Markham
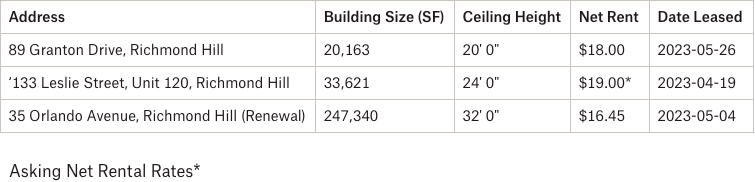

9133 Leslie Street, Richmond Hill


285 Industrial Parkway South, Aurora
Portfolio Sale


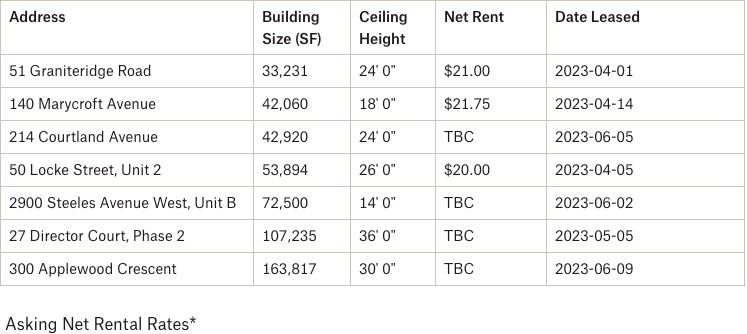
- Rental Rates: The Toronto-North markets now have a weighted average rental rate of $18.98 PSF net, the highest across the GTA regions. Keep in mind that rental rates are a weighted average, and also subject to annual escalations. We continue to see a general upward pressure across the board into the high-teens to low-twenties, depending on a number of factors, such as building size, location, ceiling height, etc. Based on the increase of value of industrial land, infill sites, construction costs, etc… we can only see these rates continue to grow. Overall, we are still in a Landlord’s market.
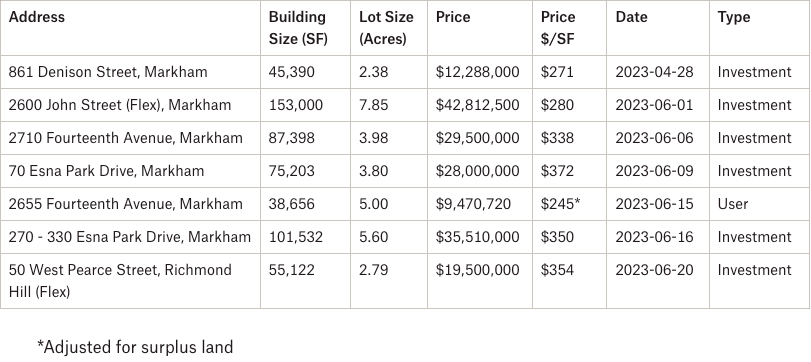
- Property Values: The Toronto-North markets have the highest weighted-average asking sale price across the GTA at $468.76 PSF, due to the lack of availabilities and cost to construct. Depending on the building size and location, and especially for Class A, well-located space, pricing shall remain strong. Given the most recent increases in interest rates, we will see an impact on CAP rates.
- Development Opportunities: The Toronto-North markets still have quite a bit of land available for development in Vaughan-West along Highway 50. We are also going to see further development along Highway 400 as land sites in more central areas become more scarce. Regarding industrial land, pricing generally continues to increase.
So, how much is your property really worth?
What rental rate can you expect or how much per SF would you be able to get if you sell your building? How much can we compress CAP rates to create even greater value?
Well, the answers to these questions will depend on a variety of factors, many of which we can quickly uncover in an assessment of your situation. And with our rental rates and valuations at all-time highs, and vacancy rates low, finding the right property is a real challenge.
Having said that, a lot of transactions are being done off the market.. and to participate in that, you should connect with experienced brokers that have long-standing relationships with property owners.
For a confidential consultation or a complimentary opinion of value of your property please give us a call.
Until next week…
Goran Brelih and his team have been servicing Investors and Occupiers of Industrial properties in Toronto Central and Toronto North markets for the past 30 years.
Goran Brelih is an Executive Vice President for Cushman & Wakefield ULC in the Greater Toronto Area.
Over the past 30 years, he has been involved in the lease or sale of approximately 25.7 million square feet of industrial space, valued in excess of $1.6 billion dollars while averaging between 40 and 50 transactions per year and achieving the highest level of sales, from the President’s Round Table to Top Ten in GTA and the National Top Ten.
Specialties:
Industrial Real Estate Sales and Leasing, Investment Sales, Design-Build and Land Development
About Cushman & Wakefield ULC.
Cushman & Wakefield (NYSE: CWK) is a leading global real estate services firm that delivers exceptional value for real estate occupiers and owners. Cushman & Wakefield is among the largest real estate services firms with approximately 53,000 employees in 400 offices and 60 countries.
In 2020, the firm had revenue of $7.8 billion across core services of property, facilities and project management, leasing, capital markets, valuation and other services. To learn more, visit www.cushmanwakefield.com.
For more information on GTA Industrial Real Estate Market or to discuss how they can assist you with your real estate needs please contact Goran at 416-756-5456, email at goran.brelih@cushwake.com, or visit www.goranbrelih.com.
Connect with Me Here! – Goran Brelih’s Linkedin Profile: https://ca.linkedin.com/in/goranbrelih
Goran Brelih, SIOR
Executive Vice President, Broker
Cushman & Wakefield ULC, Brokerage.
www.cushmanwakefield.com
Office: 416-756-5456
Mobile: 416-458-4264
Mail: goran.brelih@cushwake.com
Website: www.goranbrelih.com