
Establishing True Valuations Across Differing Markets
November 3rd, 2023
- Alan Blinder, Professor of Economics, Princeton University
While we cannot say that economic conditions have impacted businesses quite so deeply or universally across geographic markets, there has undoubtedly been a pullback in space needs by industrial users; specifically warehousers that expanded aggressively during the post-pandemic boom.
Although these shelved plans or sublet spaces may not be large in number, when they do hit the market, they’re at hundreds of thousands of square feet at a time – due simply to the scale of the operations shedding them.
At the same time, we have seen record levels of new deliveries on the mid- to tail-end of the GTA industrial market’s largest-ever construction pipeline.
Looking back just a single year, the Greater Toronto industrial market had only 0.8% of availability across its 800-million-plus of inventory.
Today, that figure has more than doubled to 1.9%; still well below the ‘equilibrium’ rate of approximately 4 percent, but – nonetheless – a significant uptick and reversal of its previous trajectory.
Meanwhile, the bite of borrowing costs has gutted industrial sales volumes and resulted in the dissuasion or deferral of purchasing decisions for stakeholders whose primary strategy lies outside of deploying dry powder. Despite the holding pattern by Central Banks, the damage has already been done; a move deemed necessary to combat accelerating inflation.
Now that both inflation and expectations of future rate hikes seem to be diminished, we can expect more stability in pricing and costs. Stability is good. Flat – or slowly declining – rates means businesses can more accurately forecast their financials and budget for their real estate expenses and investments. It also helps investors regain confidence.
The only question remaining is – going back to the quote above – what the long-term impact of diminished consumer demand may have on the market. Because, up until now, most newsworthy sound bites have revolved around e-commerce or logistics giants letting go of one or two facilities in the region to rightsize their footprints.
However, will these decisions be replicated by small- and medium-sized enterprises? And, with many 5- and 10-year lease renewals coming due in 2024 at significant increases right as we see – for the first time in a long time – a modicum of available space, will rents finally see some downward pressure?
How this plays out remains to be seen. Well-capitalized businesses will continue to make bold moves. Aggressive investors will deploy capital to scoop up income-producing assets. And well-oiled developers will be bringing to market some of the largest, modern, high-clear facilities we’ve ever seen. What we may begin to see, however, are more challenges, more time needed to transact, and a more balanced dynamic for buyers and tenants.
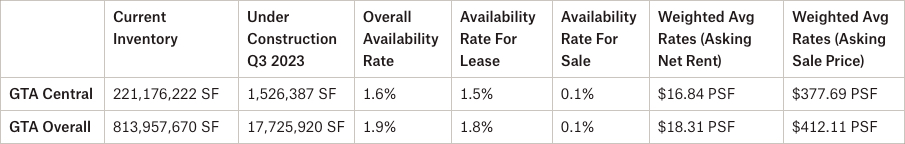
- The availability rate increased from 1.5% to 1.6%, with a lease availability rate of 1.5% and a sale availability rate of 0.1%;
- We had 1,526,387 SF under construction;
- We had 42,742 SF of negative absorption;
- The weighted average asking net rent was $16.84 PSF, down slightly from $17.39 the previous quarter, with additional rent of $4.51 PSF (an increase from $4.47 PSF); and
- The weighted average asking sale price increased from $370.74 PSF to $377.69 PSF.
Why are the GTA Central Markets in such demand?
Is it proximity to labour and a higher population density, and thus, a reduction in transportation cost? Or is it savings in development charges vs 905 areas, proximity to major transportation nodes, highways, public transportation, etc?… Or all of the above?
Well, one thing is for certain, the Toronto-Central Markets are highly sought-after by both Investors and Occupiers of commercial real estate and is an environment worth exploring for opportunities.
So, if you are an Investor, Landlord, or Owner-Occupier you may be wondering…
“How much is my property really worth?”
What rental rate can I expect? How much $/PSF would I be able to get if I sold my building?
These questions are being asked all the time.
The answer to this will depend on a range of factors, including:
- the age and size of the building,
- lot size,
- ceiling height,
- office component,
- parking,
- trucking access,
- truck parking if available, etc….
This week we are covering the Toronto Central Markets (Toronto, North York, Etobicoke & Scarborough)
Statistical Summary – GTA Central Markets – Q3 2023

Q3 2023 GTA Industrial Market Overview – Source: Cushman & Wakefield
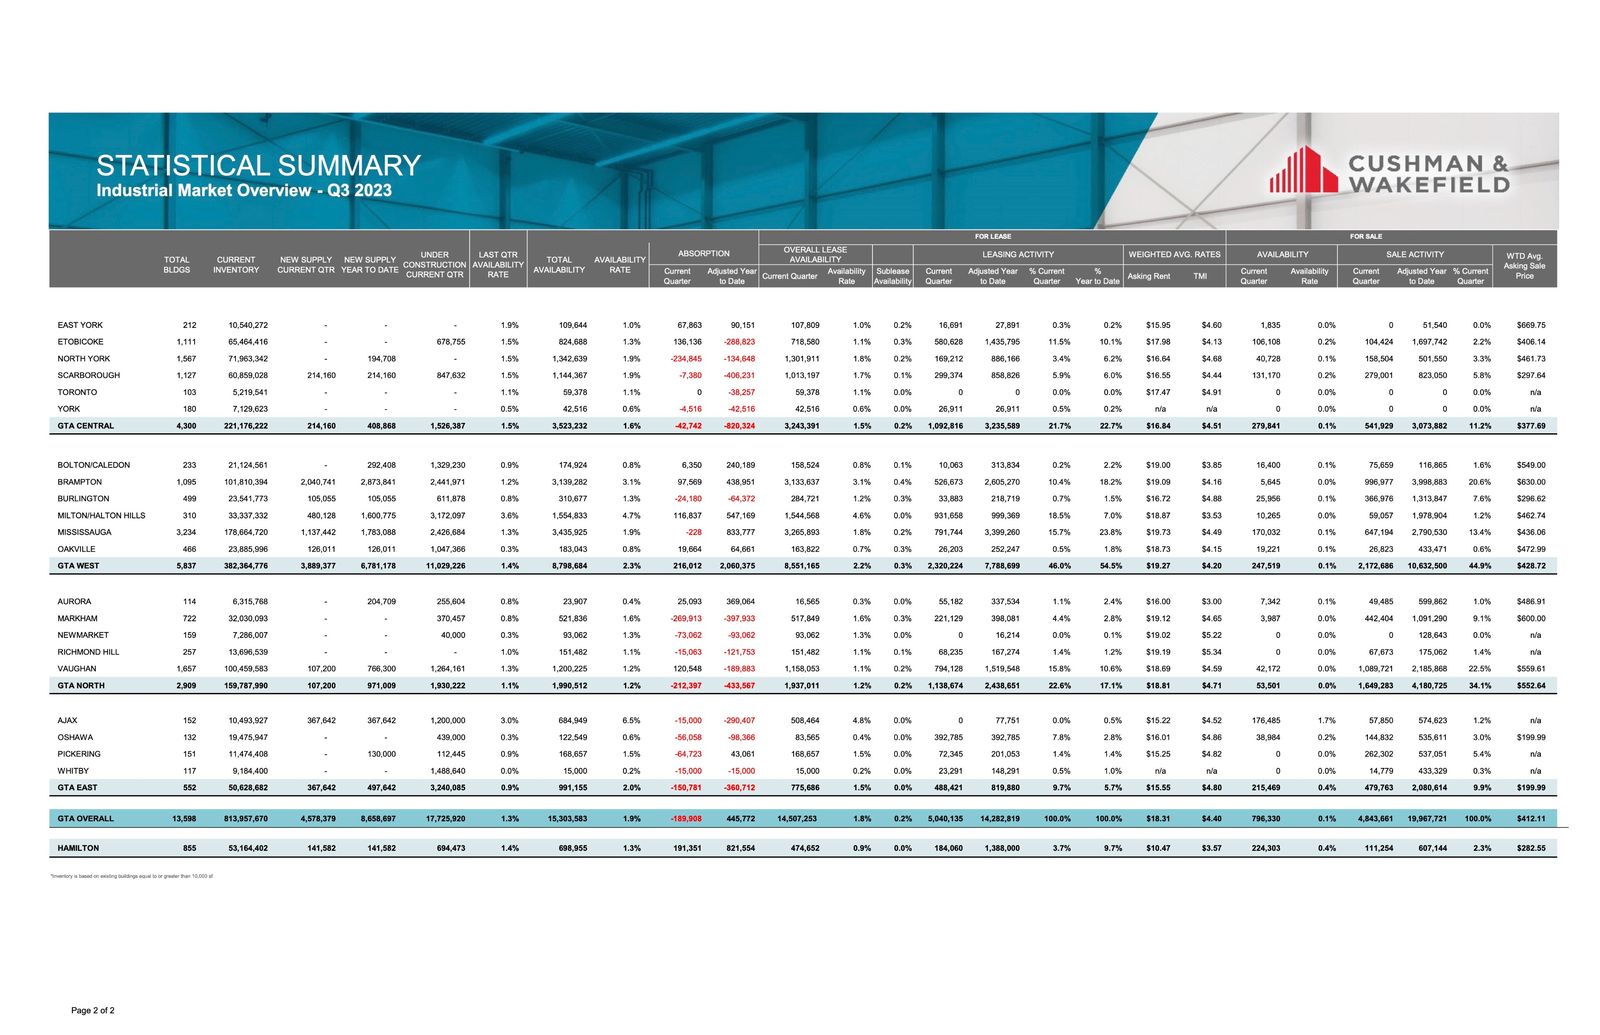
Q3 2023, Industrial Market Overview – Source: Cushman & Wakefield
GTA Central Markets (Scarborough)
Properties Sold between July 2023 – September 2023, from 20,000 SF plus
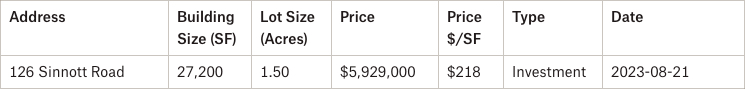
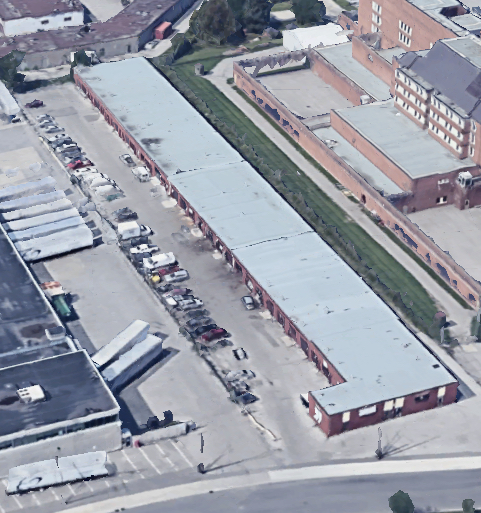
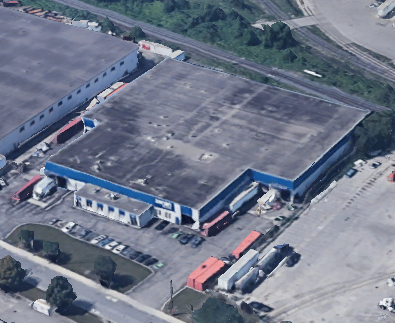
126 Sinnott Road, Scarborough.
Properties Leased between July 2023 – September 2023, from 20,000 SF plus

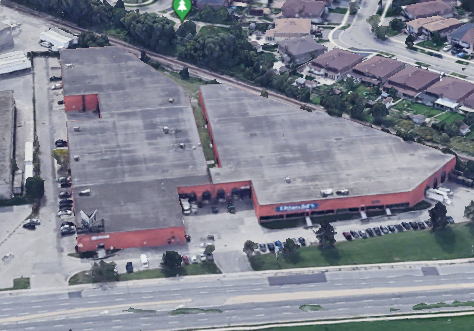
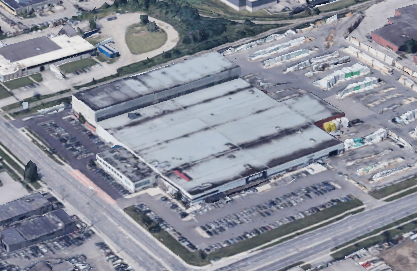
 985 Passmore Avenue, Scarborough.
Properties Sold between July 2023 – September 2023, from 20,000 SF plus

430 Flint Road, North York.
Properties Leased between July 2023 – September 2023, from 20,000 SF plus
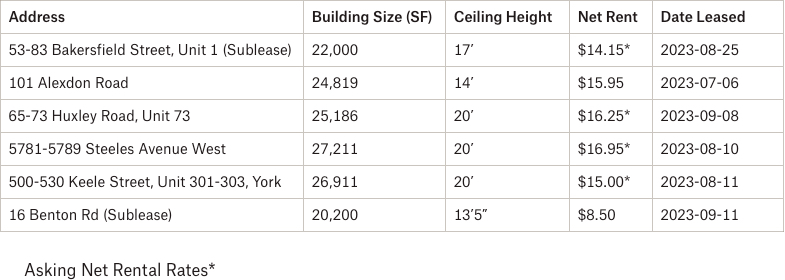
5781-5789 Steeles Avenue West, North York.

1170 Martin Grove Road, Etobicoke.
Properties Leased between July 2023 – September 2023, from 20,000 SF plus

 60 Birmingham Street, Etobicoke.
- Rental Rates: Rents have levelled off and, in some cases, we have seen rate reductions. We expect this to continue. Likewise, annual rental escalations have plateaued and may decrease. Leasing is slower and it is taking longer to complete a deal as Tenants have become more cautious. Finally, as vacancies increase and we see negative absorption, Tenants are beginning to have options, which may spur more movement and breed competition, putting more downward pressure on rents, specifically in Class B or C industrial buildings. Overall, we are heading towards a more balanced market between Landlords and Tenants.
- Property Values: As rental rates plateau, and as we see rents decrease in certain properties, coupled with upward pressure on cap rates, we are going to see a decrease in value of investment properties. For users, even though the Buyer pool may have thinned due to increased interest rates, we expect to see values remain elevated as supply is extremely limited. Finally, due to the aforementioned interest rates, the value of development land has decreased.
- Development Opportunities: Looking across the Toronto-Central markets, there is still great interest from developers to purchase infill sites and redevelop older and obsolete industrial buildings to newer, modern distribution centres, as well as industrial condos. Given its central location and proximity to major highways and labour, larger industrial sites in the Toronto-Central markets will continue to be in great demand.
Conclusion:
So, how much is your property really worth?
What rental rate can you expect or how much per SF would you be able to get if you sell your building? How much can we compress CAP rates to create even greater value?
Well, the answers to these questions will depend on a variety of factors, many of which we can quickly uncover in an assessment of your situation. And with our rental rates and valuations at all-time highs, and vacancy rates low, finding the right property is a real challenge.
Having said that, a lot of transactions are being done off the market.. and to participate in that, you should connect with experienced brokers that have long-standing relationships with property owners.
For a confidential consultation or a complimentary opinion of value of your property please give us a call.
Until next week…
Goran Brelih and his team have been servicing Investors and Occupiers of Industrial properties in Toronto Central and Toronto North markets for the past 30 years.
Goran Brelih is an Executive Vice President for Cushman & Wakefield ULC in the Greater Toronto Area.
Over the past 30 years, he has been involved in the lease or sale of approximately 25.7 million square feet of industrial space, valued in excess of $1.6 billion dollars while averaging between 40 and 50 transactions per year and achieving the highest level of sales, from the President’s Round Table to Top Ten in GTA and the National Top Ten.
Specialties:
Industrial Real Estate Sales and Leasing, Investment Sales, Design-Build and Land Development
About Cushman & Wakefield ULC.
Cushman & Wakefield (NYSE: CWK) is a leading global real estate services firm that delivers exceptional value for real estate occupiers and owners. Cushman & Wakefield is among the largest real estate services firms with approximately 53,000 employees in 400 offices and 60 countries.
In 2020, the firm had revenue of $7.8 billion across core services of property, facilities and project management, leasing, capital markets, valuation and other services. To learn more, visit www.cushmanwakefield.com.
For more information on GTA Industrial Real Estate Market or to discuss how they can assist you with your real estate needs please contact Goran at 416-756-5456, email at goran.brelih@cushwake.com, or visit www.goranbrelih.com.
Connect with Me Here! – Goran Brelih’s Linkedin Profile: https://ca.linkedin.com/in/goranbrelih
Goran Brelih, SIOR
Executive Vice President, Broker
Cushman & Wakefield ULC, Brokerage.
www.cushmanwakefield.com
Office: 416-756-5456
Mobile: 416-458-4264
Mail: goran.brelih@cushwake.com
Website: www.goranbrelih.com