
Q4 2021 Insight, Toronto-West Markets
Establishing True Valuations Across Differing Markets
February 4th, 2022
After every paradigm shift, we typically see a diffusion of innovations across the market in tranches.
First, we have the innovators themselves who comprise around 2.5% of the market, followed by the early adopters (13.5%), the early majority (34%), the late majority (34%), and the laggards (15%).
According to Statista, global e-commerce is forecast to hit $4.2 trillion USD in 2022, reaching $5.8 trillion USD by 2025. User penetration is expected to hit 53.8% in 2022 and 62.4% by 2025.
However, e-commerce’s share of total retail sales sits at just 17.9%, with expectations of reaching 22.4% by 2025.
This means that, depending on how you slice the numbers, we are somewhere in the late majority for user adoption and entering the early majority for share of total retail sales. And this process will easily continue and for the next decade or two as retailers build out their digital infrastructure, such as their online platforms, Big Data, marketing distribution channels, and advertising strategies.
As a direct result of this, we can only expect the demand for industrial facilities and land to increase further as these businesses either construct their own warehousing and distribution networks or partner with third-party logistics firms – who will in turn, require more space to service their clientele.
When viewed through the lens of innovation itself, we can observe that this process of securing industrial logisitcs space is itself moving into the early majority. The innovators, such as Amazon, FedEx, and UPS, led the way in doing blockbuster deals and rapidly growing out their regional distribution centres, sorting facilities, and last-mile sites.
This begs the question, will this continue forever? Or will the behemoths reach a point where their networks are adequate, and the focus will turn to warehouse systems and portfolio management?
While the Amazons of the world are not done buying, leasing, and developing space just yet, we expect the long tail of retailers to become more involved in the activity. Those that pivoted their models in 2020 and 2021 may now be ready to roll out their omnichannel strategies. Those whose brands took off and reached the next growth phase will also need to facilitate their operations with industrial space.
As such, we expect the rest of the vibrant e-commerce ecosystem to secure their needs in the coming years. Coupled with the accelerating on-shoring of manufacturing operations, and it appears that demand will remain uninterrupted for the foreseeable future; barring any sudden, massive changes.
Investors, developers, and landlords looking to capture this demand should remain diligent around identifying opportunities; whether that be through the strategic purchasing of industrial land, value-add redevelopment, or buying cashflow from occupiers willing to pay premium rents.
Key Takeaways from Q4 2021 – Toronto West Markets
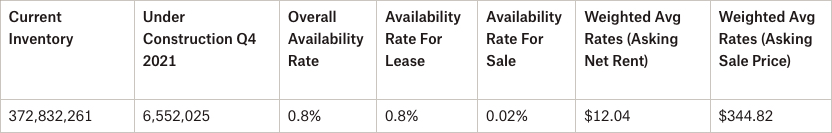
- The availability rate was 0.8%, with a lease availability rate of 0.8% and a sale availability rate close to 0.02%;
- We had 1,335,460 SF of construction completed and 6,552,025 SF still under construction;
- We had absorption of 1,673,255 SF;
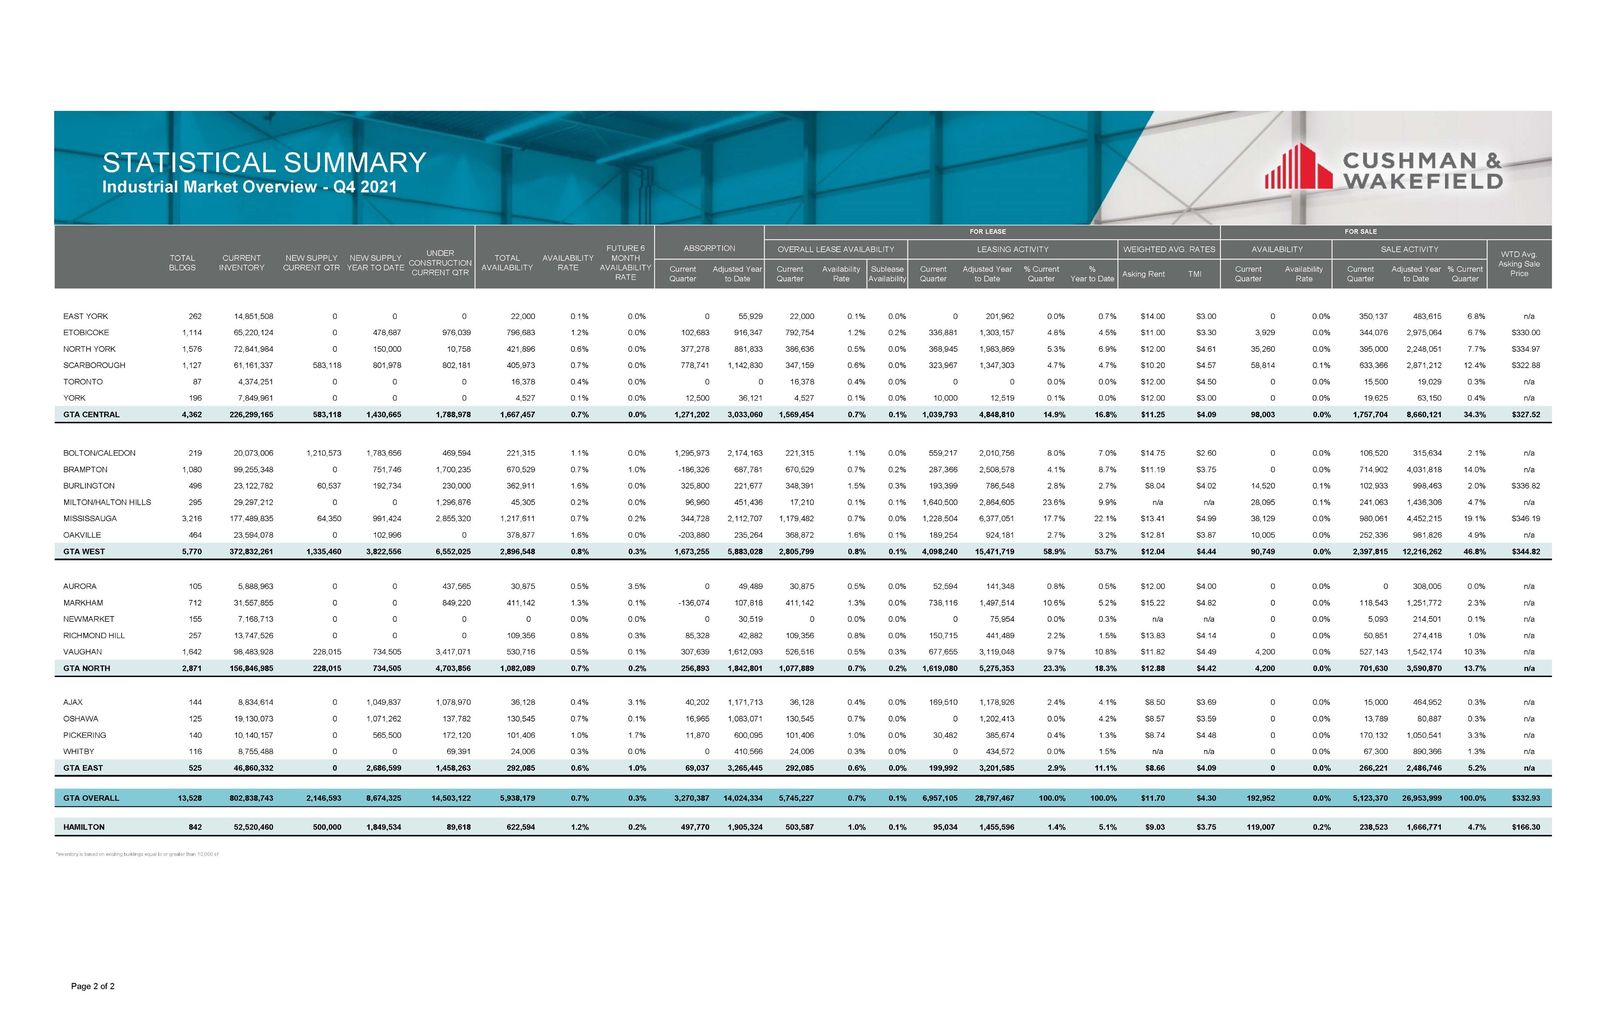
- Bolton and Caledon achieved the highest weighted asking net rental rates in Q4 2021 at $14.75 PSF, followed by the City of Mississauga at $13.41 PSF and Oakville at $12.81 PSF;
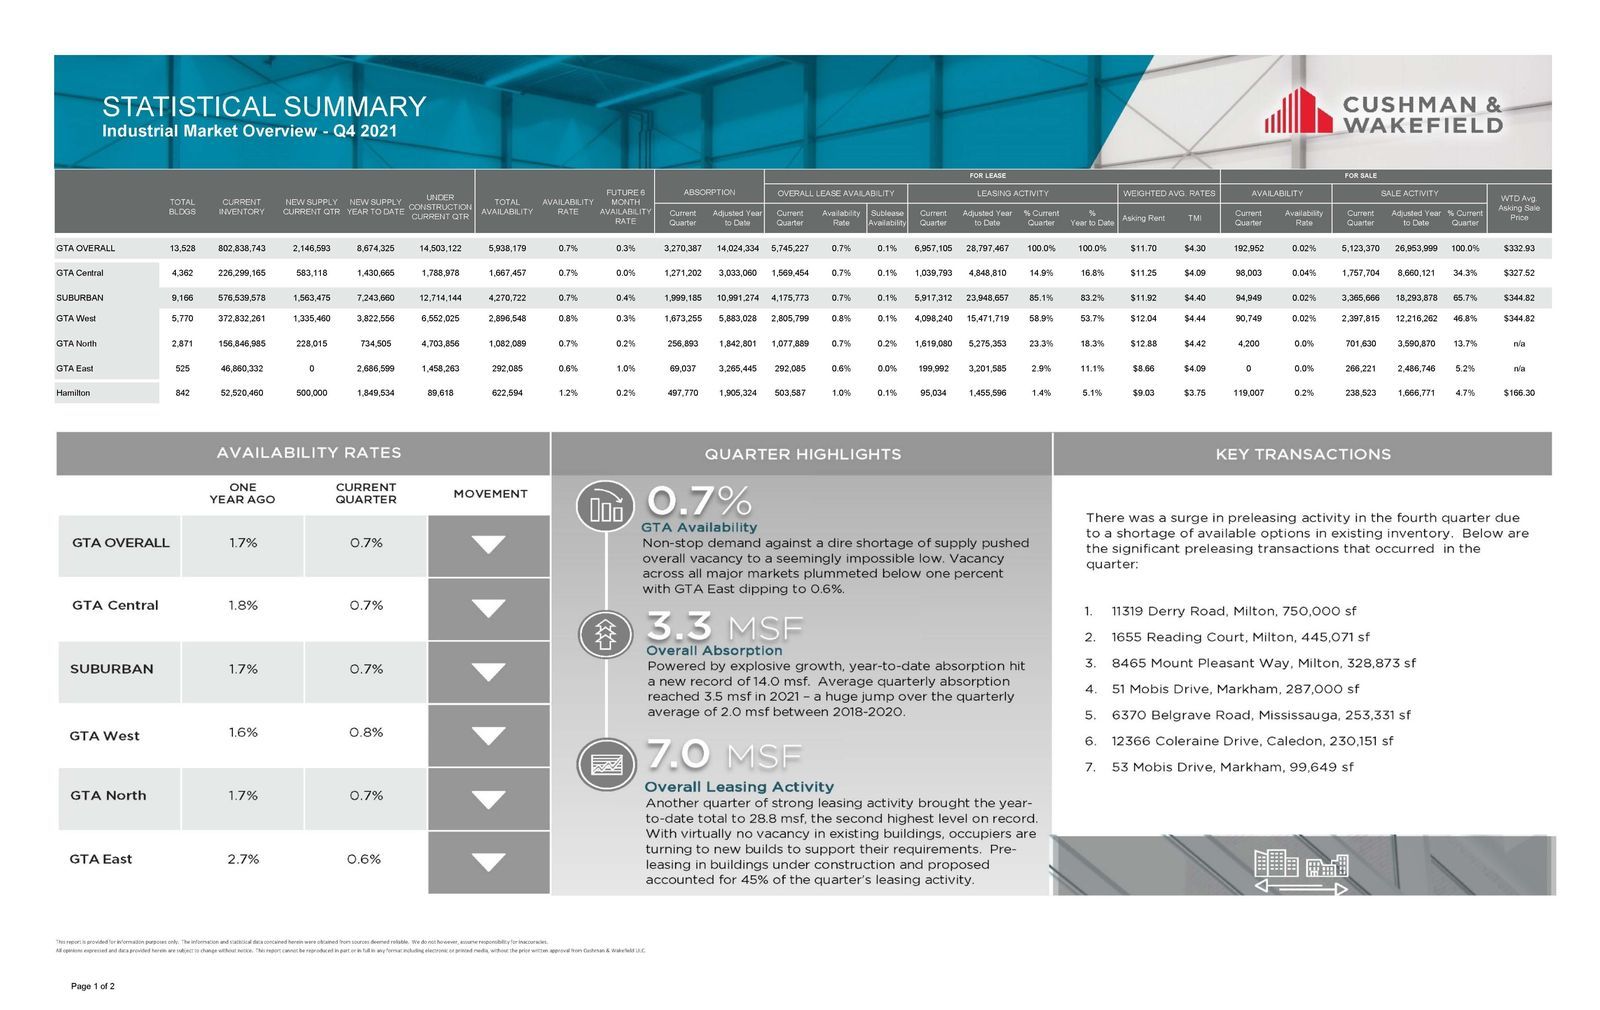
- The availability rate across the entire GTA is 0.7%, down from 0.9% in Q3 2021;
- The weighted average asking net rent increased from $11.65 to $12.04 PSF with additional rent of $4.44 PSF; and the
- Weighted average asking sale price was $344.82 PSF.
Why are the GTA West Markets in such demand?
The GTA West Industrial Markets are by far the largest industrial markets in the GTA, representing about 46% of GTA Industrial Inventory, or about 372,832,261 SF. The GTA West Markets were very active this quarter, with more than 6,552,025 SF under construction and a flurry of lease and sale transactions completed.
So, if you are an Investor, Landlord, or Owner-Occupier you may be wondering…
“How much is my property really worth?”
What rental rate can I expect? How much $/PSF would I be able to get if I sold my building?
These questions are being asked all the time.
The answer to this will depend on a range of factors, including:
- the age and size of the building,
- lot size,
- ceiling height,
- office component,
- parking,
- trucking access,
- truck parking if available, etc….
This week we are covering the Toronto-West Markets
(Mississauga, Brampton, Oakville, Milton, Caledon, Burlington & Halton Hills)
Statistical Summary – GTA West Markets – Q4 2021
Properties Sold between October 2021 – December 2021, from 20,000 SF – 50,000 SF
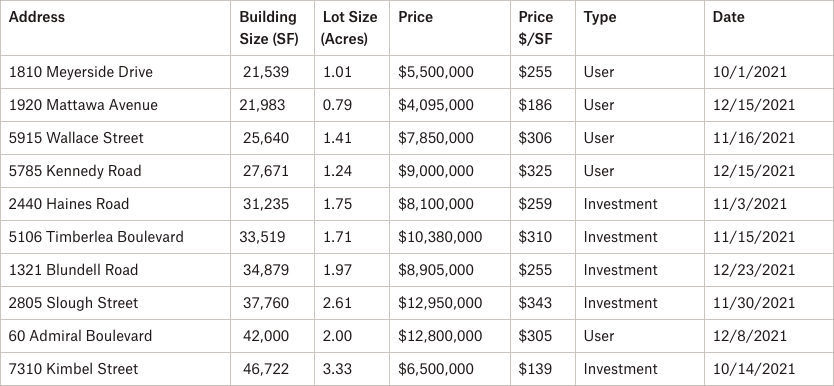
60 Admiral Blvd, Mississauga
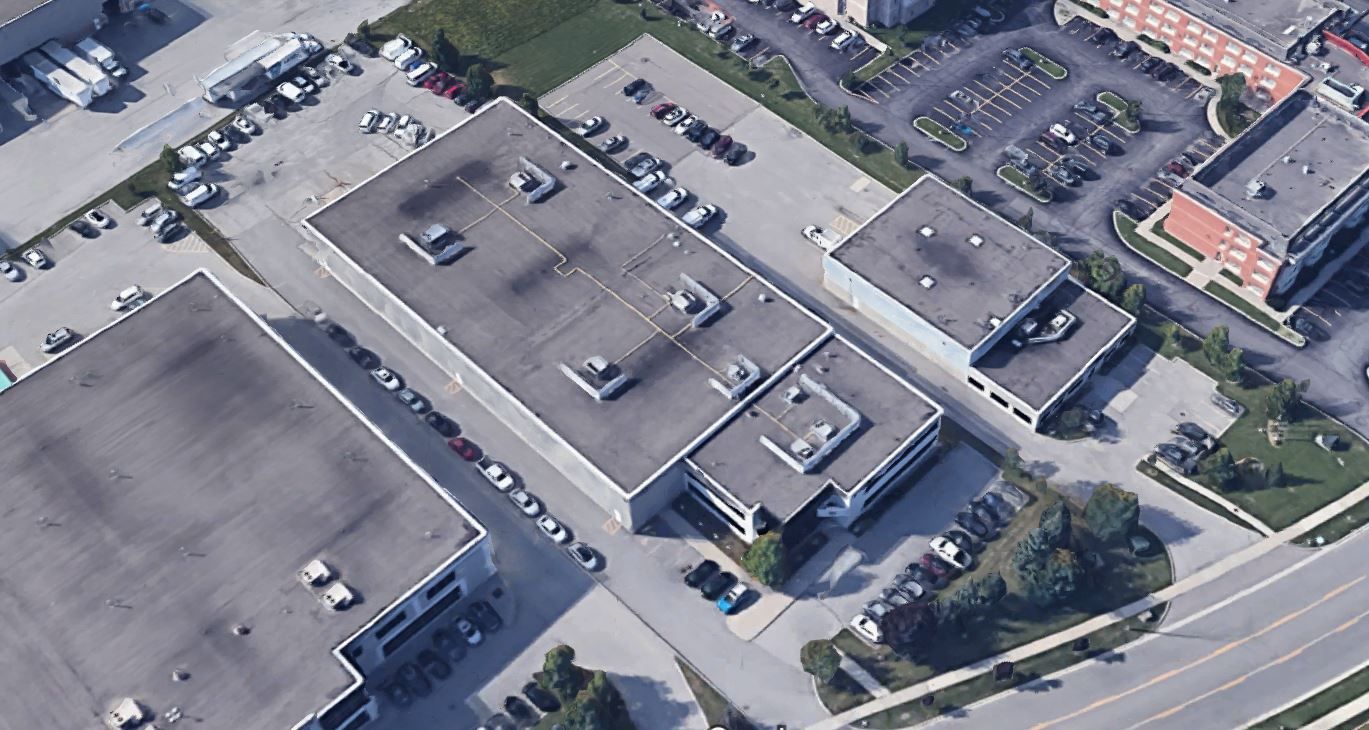
Properties Sold between October 2021 – December 2021, from 50,000 SF plus
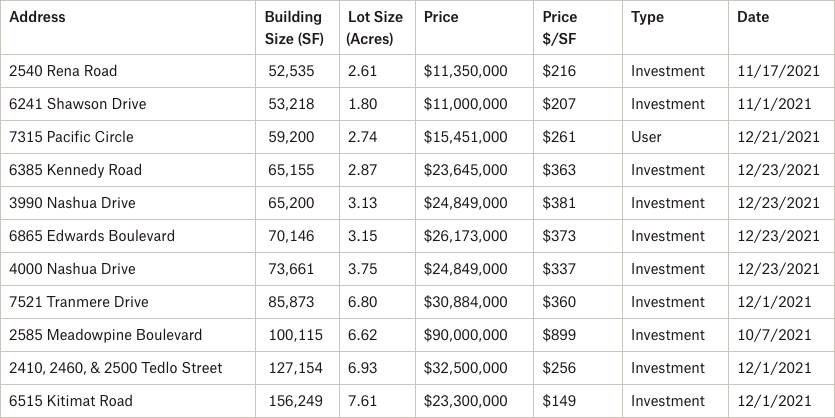
6515 Kitimat Road, Mississauga
Properties Leased between October 2021 – December 2021, from 20,000 SF – 50,000SF
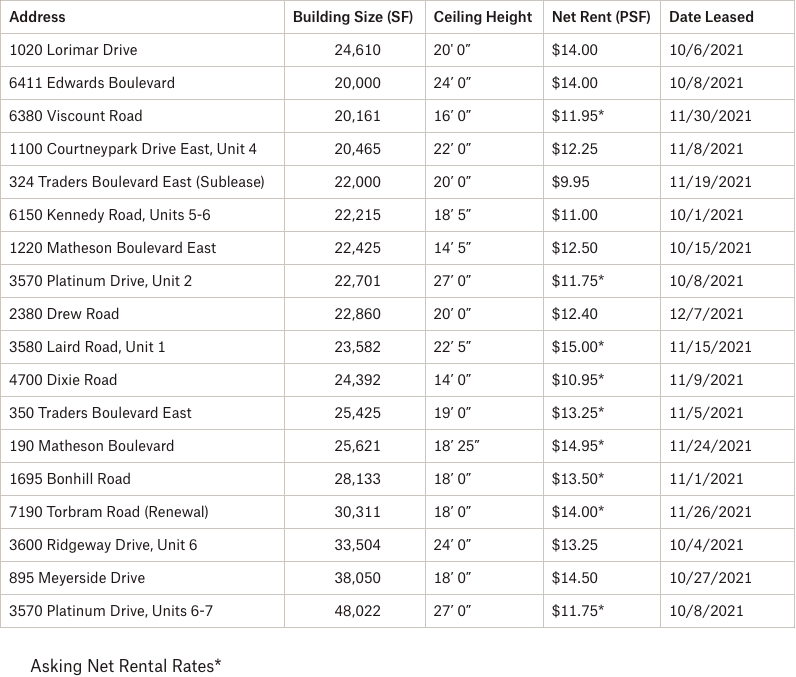
6411 Edwards Boulevard, Mississauga
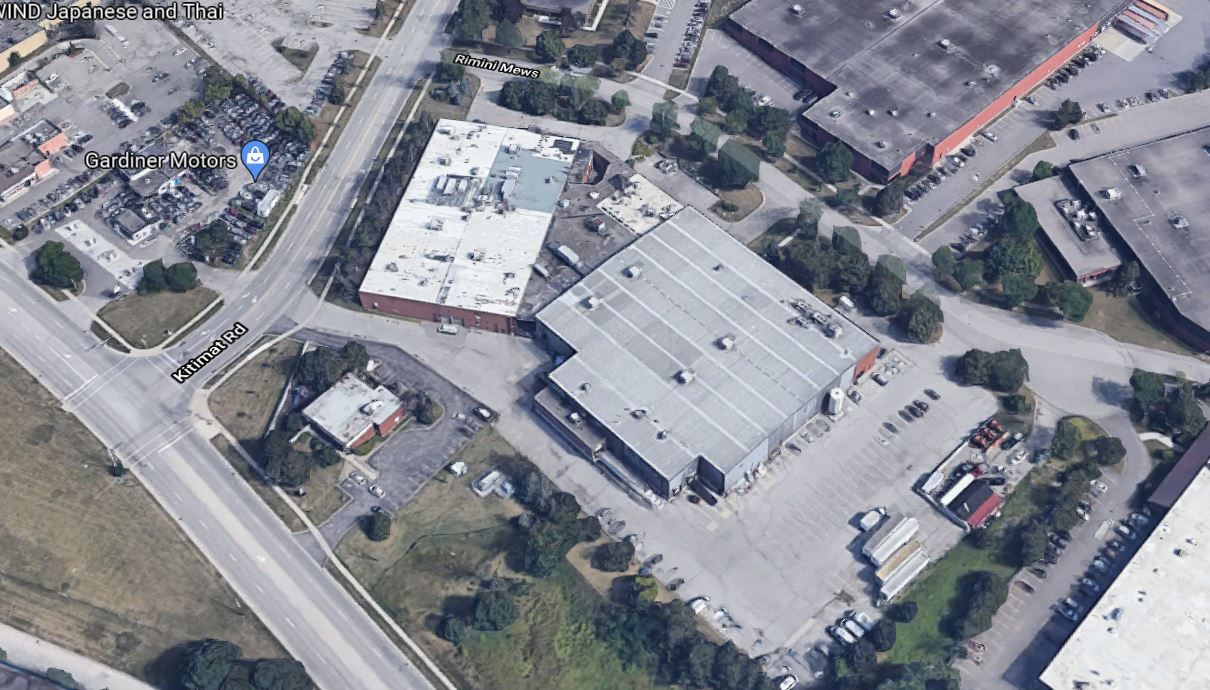
Properties Leased between October 2021 – December 2021, from 50,000 SF plus
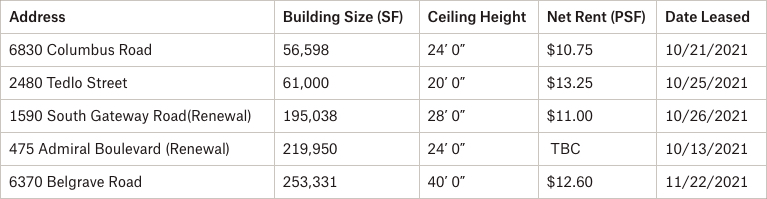
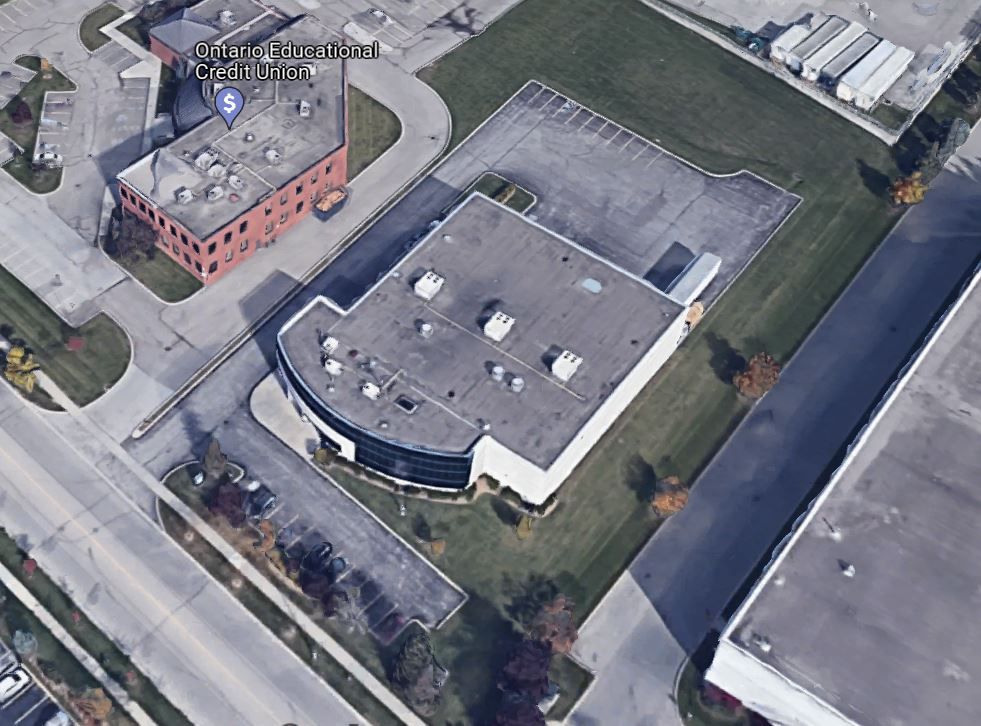
6370 Belgrave, Mississauga
Properties Sold between October 2021 – December 2021, from 20,000 SF plus
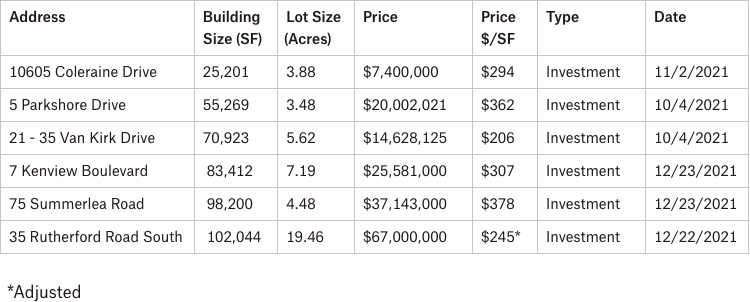
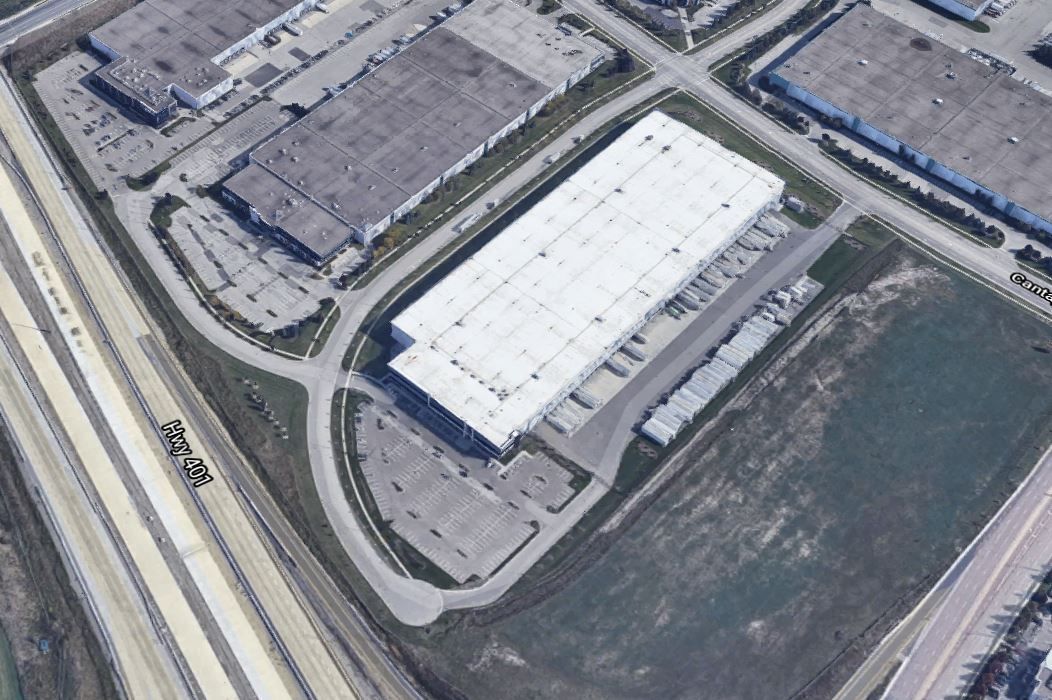
75 Summerlea Road, Brampton
Properties Leased between October 2021 – December 2021, from 20,000 SF plus
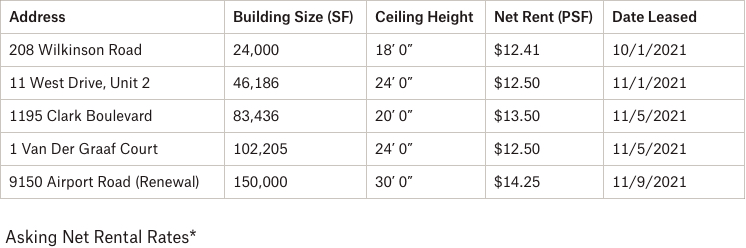
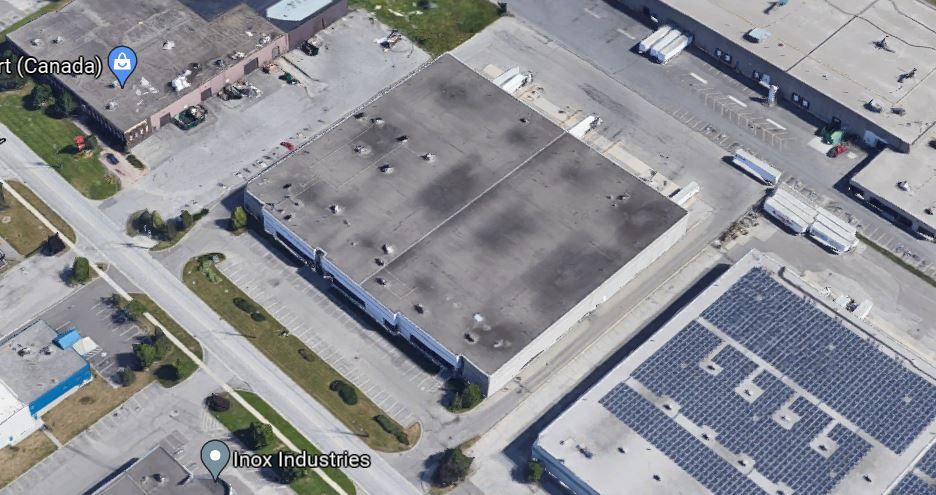
9150 Airport Road, Brampton
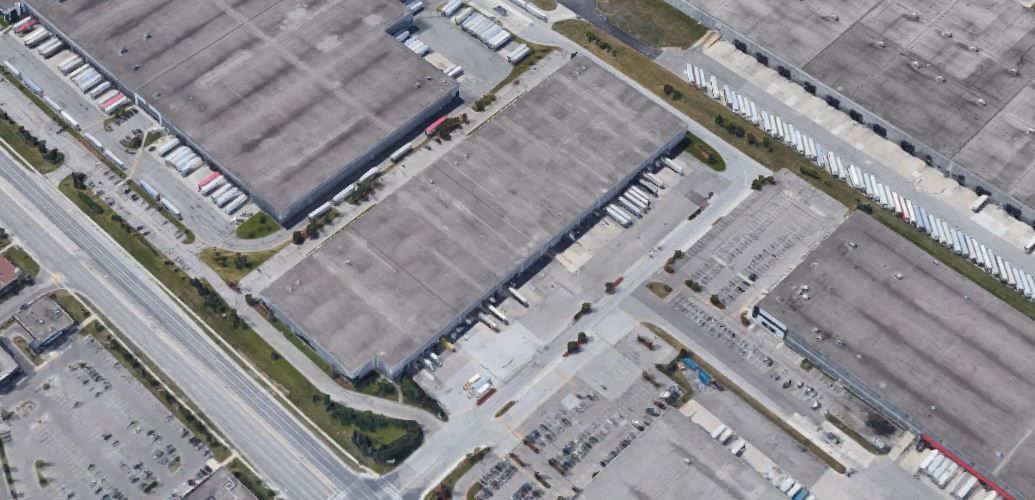
5105 Harvester Road, Burlington
Properties Leased between October 2021 – December 2021, from 20,000 SF plus
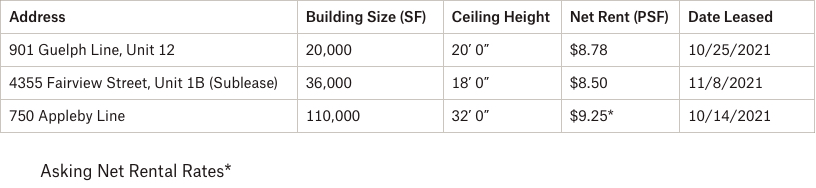
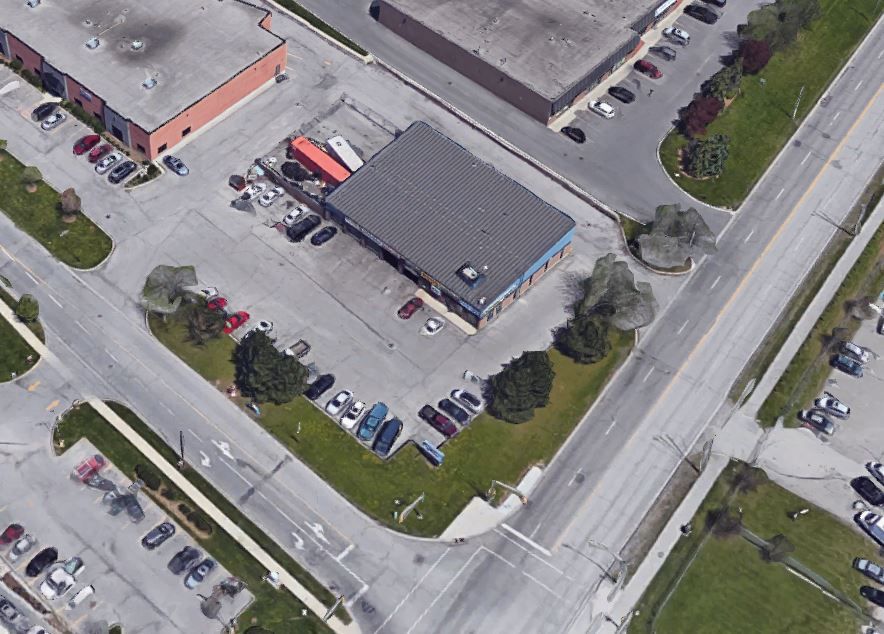
750 Appleby Line, Burlington
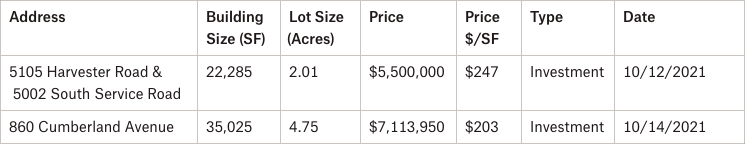
Properties Sold between October 2021 – December 2021, from 20,000 SF plus
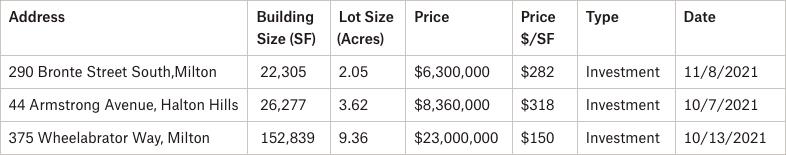
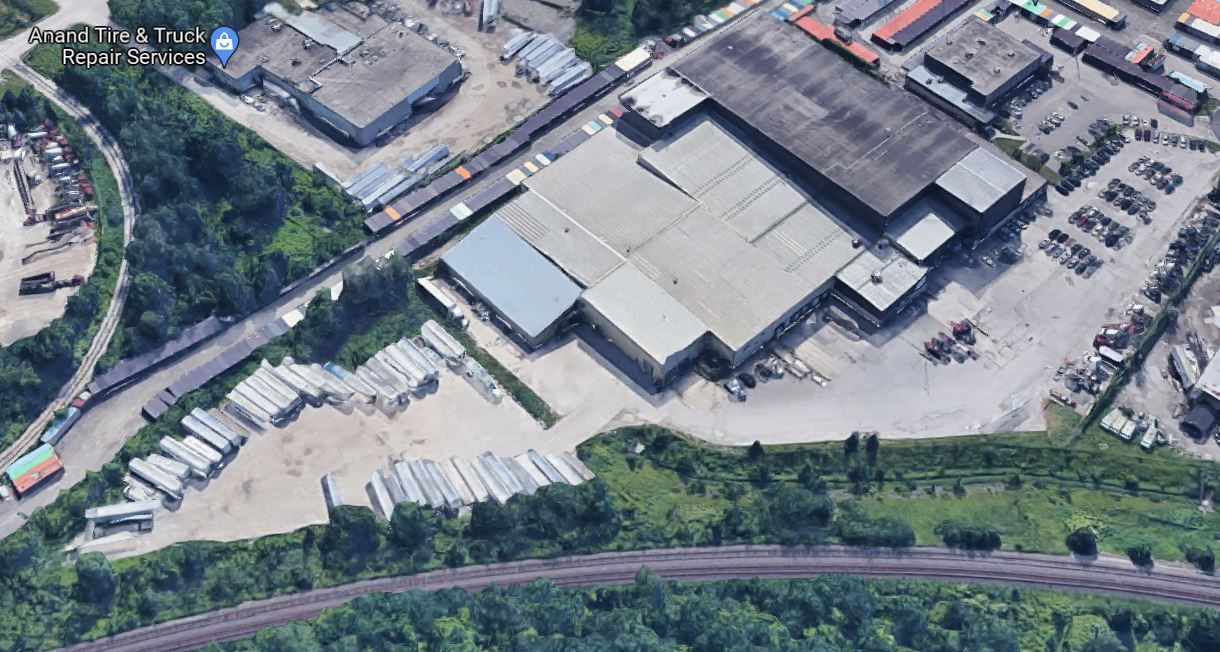
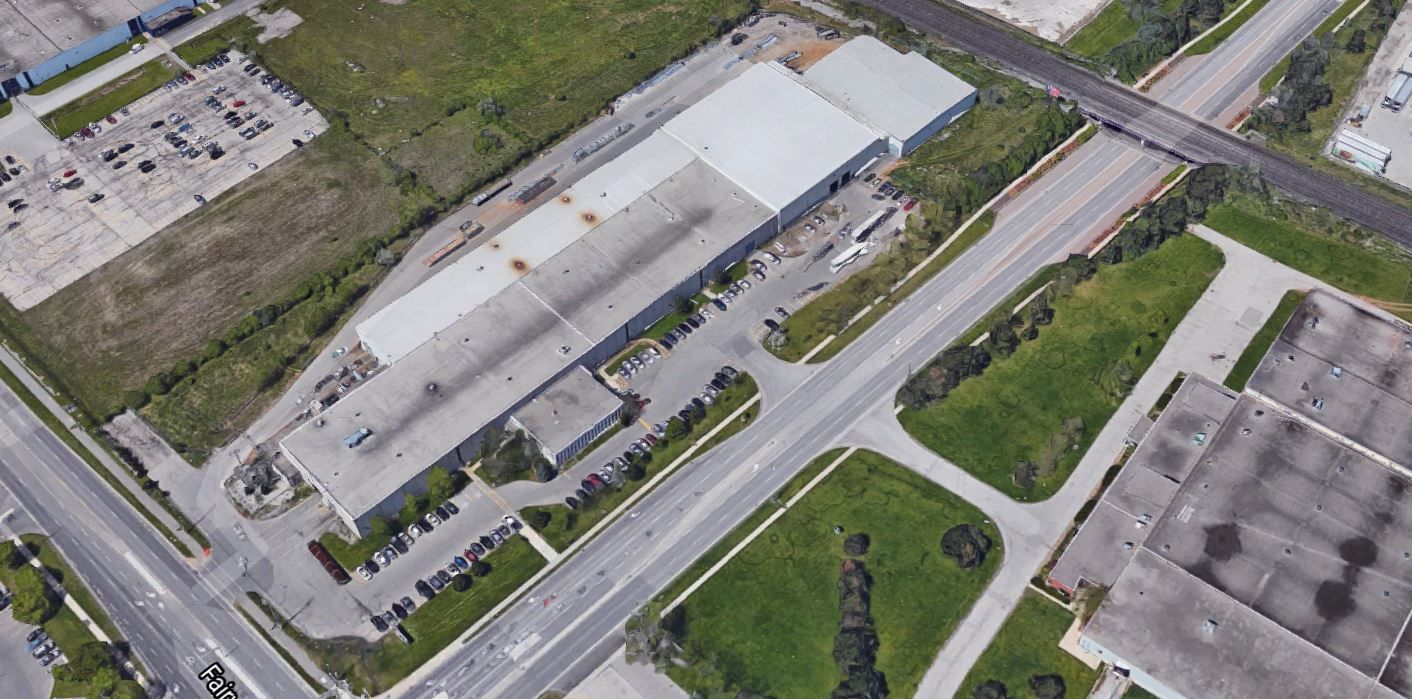
375 Wheelabrator Way, Milton
Properties Leased between October 2021 – December 2021, from 20,000 SF plus
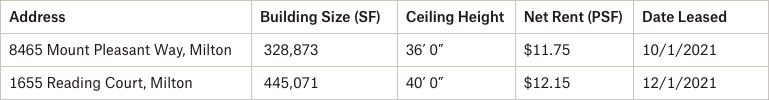
8465 Mount Pleasant Way, Milton
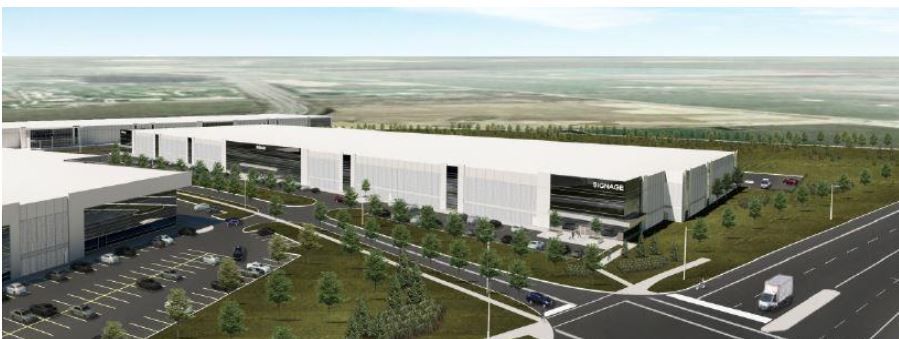
Properties Sold between October 2021 – December 2021, from 20,000 SF plus
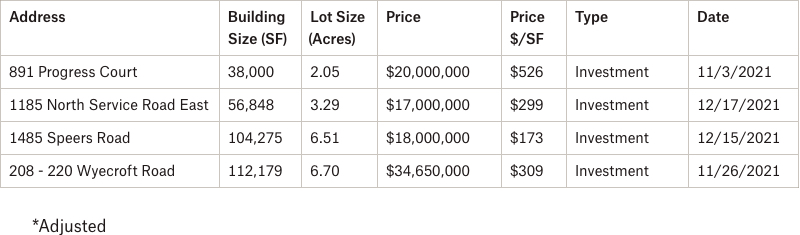
208-220 Wyecroft Road, Oakville
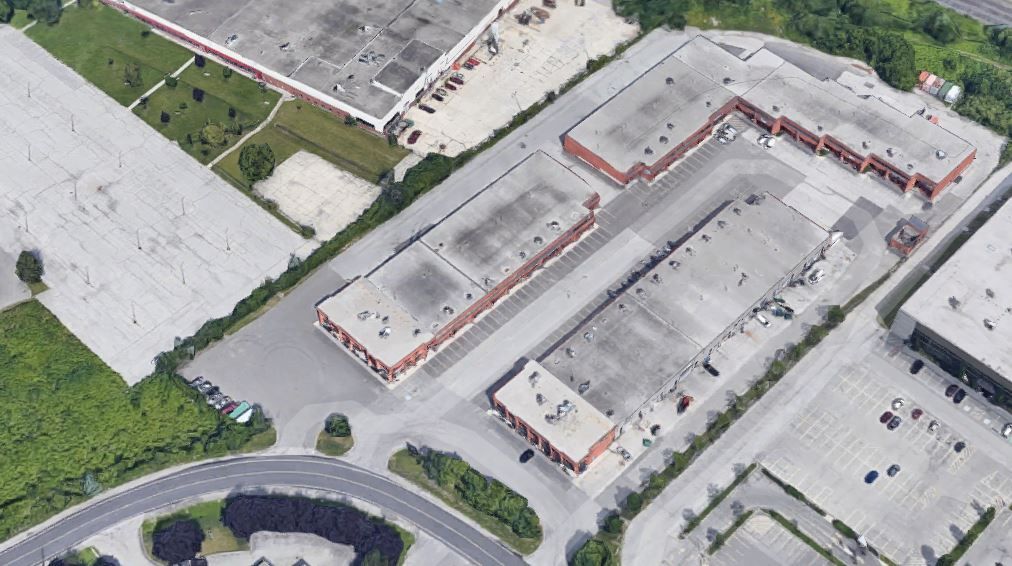
Properties Leased between October 2021 – December 2021, from 20,000 SF plus
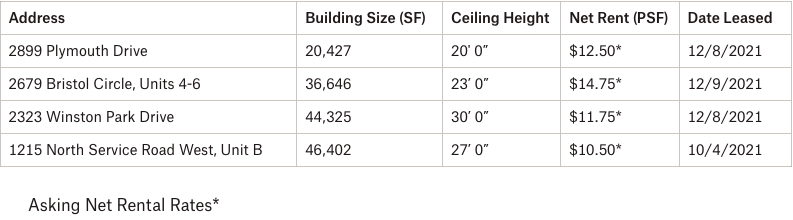
1215 North Service Road West, Oakville
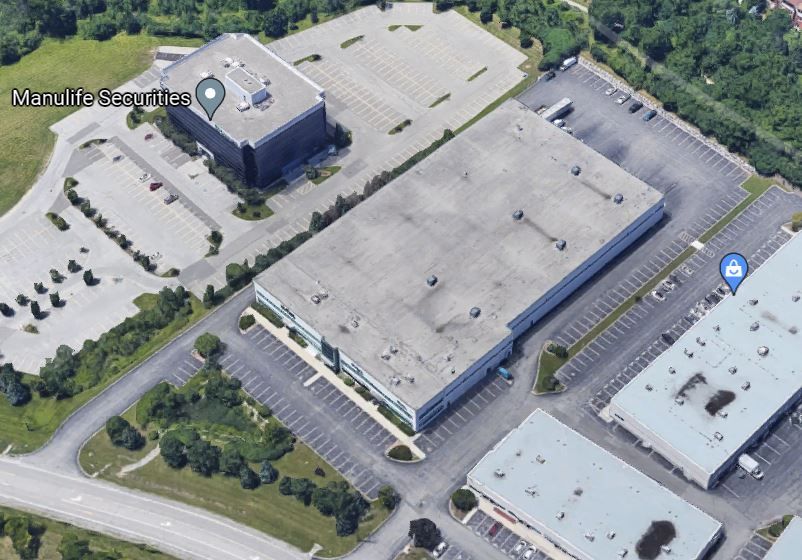
Properties Sold between October 2021 – December 2021, from 20,000 SF plus
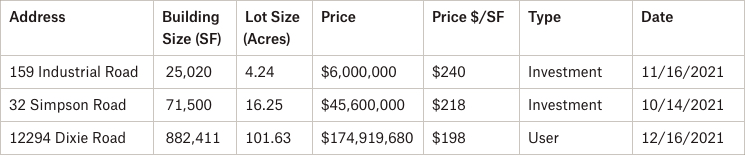
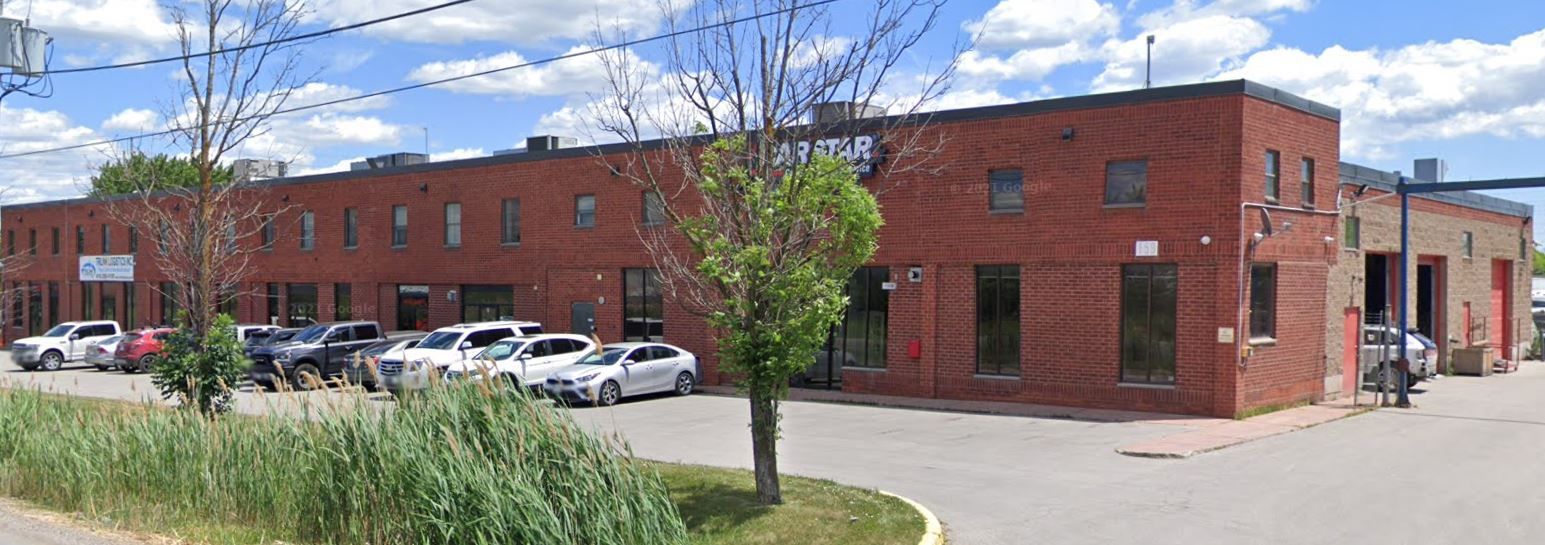
159 Industrial Road, Caledon
Properties Leased between October 2021 – December 2021, from 20,000 SF plus
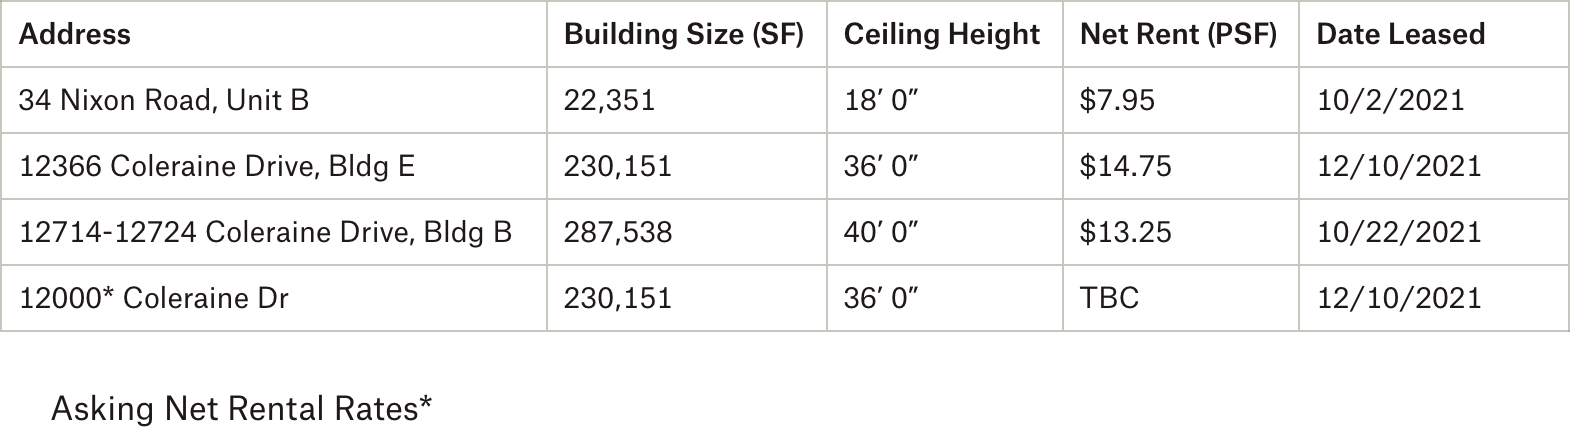
12366 Coleraine Drive, Caledon
- Rental Rates: We see many transactions achieving in excess of $12 PSF net. We are also hearing that some of the current developments are increasing their price guidance to above $14 PSF net. That trend will continue.
- Property Values: With Mississauga’s weighted average asking sale price at $346.19 PSF and Burlington’s at $336.82… these submarkets lead the GTA-West markets. And with a sale availability rate of 0.02% – or just 90,749 SF for sale out of 372.8M of inventory – prices will appreciate further.
- Development Opportunities: In the fourth quarter of 2021, we had over 6.5 million square feet under construction in the GTA-West markets. This represents approximately 45% of all new development across the GTA (14.5 million SF), making this the most active region by far. This comes as no surprise as the West markets have the most land available for development.
Conclusion:
So, how much is your property really worth?
What rental rate can you expect or how much per SF would you be able to get if you sell your building? How much can we compress CAP rates to create even greater value?
Well, the answers to these questions will depend on a variety of factors, many of which we can quickly uncover in an assessment of your situation. And with our rental rates and valuations at all-time highs, and vacancy rates low, finding the right property is a real challenge.
Having said that, a lot of transactions are being done off the market.. and to participate in that, you should connect with experienced brokers that have long-standing relationships with property owners.
For a confidential consultation or a complimentary opinion of value of your property please give us a call.
Until next week…
Goran Brelih and his team have been servicing Investors and Occupiers of Industrial properties in Toronto Central and Toronto North markets for the past 29 years.
Goran Brelih is a Senior Vice President for Cushman & Wakefield ULC in the Greater Toronto Area.
Over the past 29 years, he has been involved in the lease or sale of approximately 25.7 million square feet of industrial space, valued in excess of $1.6 billion dollars while averaging between 40 and 50 transactions per year and achieving the highest level of sales, from the President’s Round Table to Top Ten in GTA and the National Top Ten.
Specialties:
Industrial Real Estate Sales and Leasing, Investment Sales, Design-Build and Land Development
About Cushman & Wakefield ULC.
Cushman & Wakefield (NYSE: CWK) is a leading global real estate services firm that delivers exceptional value for real estate occupiers and owners. Cushman & Wakefield is among the largest real estate services firms with approximately 53,000 employees in 400 offices and 60 countries.
In 2020, the firm had revenue of $7.8 billion across core services of property, facilities and project management, leasing, capital markets, valuation and other services. To learn more, visit www.cushmanwakefield.com.
For more information on GTA Industrial Real Estate Market or to discuss how they can assist you with your real estate needs please contact Goran at 416-756-5456, email at goran.brelih@cushwake.com, or visit www.goranbrelih.com.
Connect with Me Here! – Goran Brelih’s Linkedin Profile: https://ca.linkedin.com/in/goranbrelih
Goran Brelih, SIOR
Senior Vice President, Broker
Cushman & Wakefield ULC, Brokerage.
www.cushmanwakefield.com
Office: 416-756-5456
Mobile: 416-458-4264
Mail: goran.brelih@cushwake.com
Website: www.goranbrelih.com