
Q1 2022 Insight, Toronto-Central Markets
Establishing True Valuations Across Differing Markets
April 29th, 2022
“Wind extinguishes a candle and energizes fire.”
- Nassim Taleb
Structural shifts within the economy are an effective accelerant of the existing underlying principles.
Look at office. Look at retail.
The ongoing growth of e-commerce vis-a-vis platforms such as Amazon and Shopify were already affecting brick-and-mortar stores leading up to the pandemic and the resulting switch towards online ordering and home deliveries.
Likewise, the combination of technology, outsourcing, virtual collaboration, and project management had begun to reduce the need for functions such as printing, storage, and in-person meetings. As administrative tasks were streamlined, this translated into the leaning out of firms; making vast office footprints of the previous decades unnecessary. As soon as businesses were forced to work remotely, the switch was flipped. The very concept of the office was challenged and put into question.
As a whole, these sudden and immediate shocks to demand changed employee and consumer behaviours overnight. We then collectively decided that the new way just might be a better way.
While office and retail are on the road to recovery and will evolve and adapt to focus on the experiential and cultural elements of their respective spaces, the past two years have provided them with a baptism by fire. Soon, this too will pass for the struggling sectors, yet, I doubt many of the stakeholders involved would excitedly jump at the opportunity to relive their arduous experiences.
The same may also be said by the investors, developers, and users within the industrial market. Growth is great for business. Yet, the unrelenting pace of acquisitions, leasing, and development – coupled with material and labour shortages – is no easy feat to deal with on a daily and weekly basis.
The aforementioned rise of e-commerce sparked the realization that growing online platforms would need a back-end of logistics, warehousing, and transportation space to facilitate the fulfilment of the millions of one-click purchases and 48-hour delivery promises.
And so it began. The kindling had been lit.
However, the ensuing chaos and uncertainty would only fan the flames.
Which brings us to today. Space is so scarce that users are now planning 2 to 3 years out. And with little readily available to purchase, investors are either bullying their way in with uber-premium pricing. Or they’re snapping up land anywhere they can find it.
As these values ripple downstream into rents upon renewals, we will begin to see the real effects take place. Will users be able to afford a doubling or tripling of their real estate costs? How will the market support these structural shifts long-term – both in tapping demand and providing adequate suply?
These are questions we should ponder as the Greater Toronto industrial market undergoes a remarkable transformation and begins to integrate into the City’s infrastructure and its people.
With that said, let’s examine how each of the various regions performed in Q1 2022, and where we expect the market to go moving forward.
Key Takeaways from Q1 2022 – Toronto Central Markets
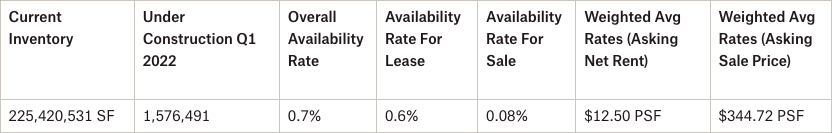
- The availability rate stayed level at 0.7%, with a lease availability rate of 0.6% and a sale availability rate of 0.08% (just 183,750 SF available for sale out of 225M SF of inventory);
- We had 1,576,491 SF under construction;
- We had 497,792 SF of absorption;
- The weighted average asking net rent was $12.50 PSF, up from $11.25 the previous quarter, with additional rent of $4.01 PSF; and
- The weighted average asking sale price was $344.72 PSF.
Why are the GTA Central Markets in such demand?
Is it proximity to labour and a higher population density, and thus, a reduction in transportation cost? Or is it savings in development charges vs 905 areas, proximity to major transportation nodes, highways, public transportation, etc?… Or all of the above?
Well, one thing is for certain, the Toronto-Central Markets are highly sought-after by both Investors and Occupiers of commercial real estate and is an environment worth exploring for opportunities.
So, if you are an Investor, Landlord, or Owner-Occupier you may be wondering…
“How much is my property really worth?”
What rental rate can I expect? How much $/PSF would I be able to get if I sold my building?
These questions are being asked all the time.
The answer to this will depend on a range of factors, including:
- the age and size of the building,
- lot size,
- ceiling height,
- office component,
- parking,
- trucking access,
- truck parking if available, etc….
This week we are covering the Toronto Central Markets (Toronto, North York, Etobicoke & Scarborough)
Statistical Summary – GTA Central Markets – Q1 2022
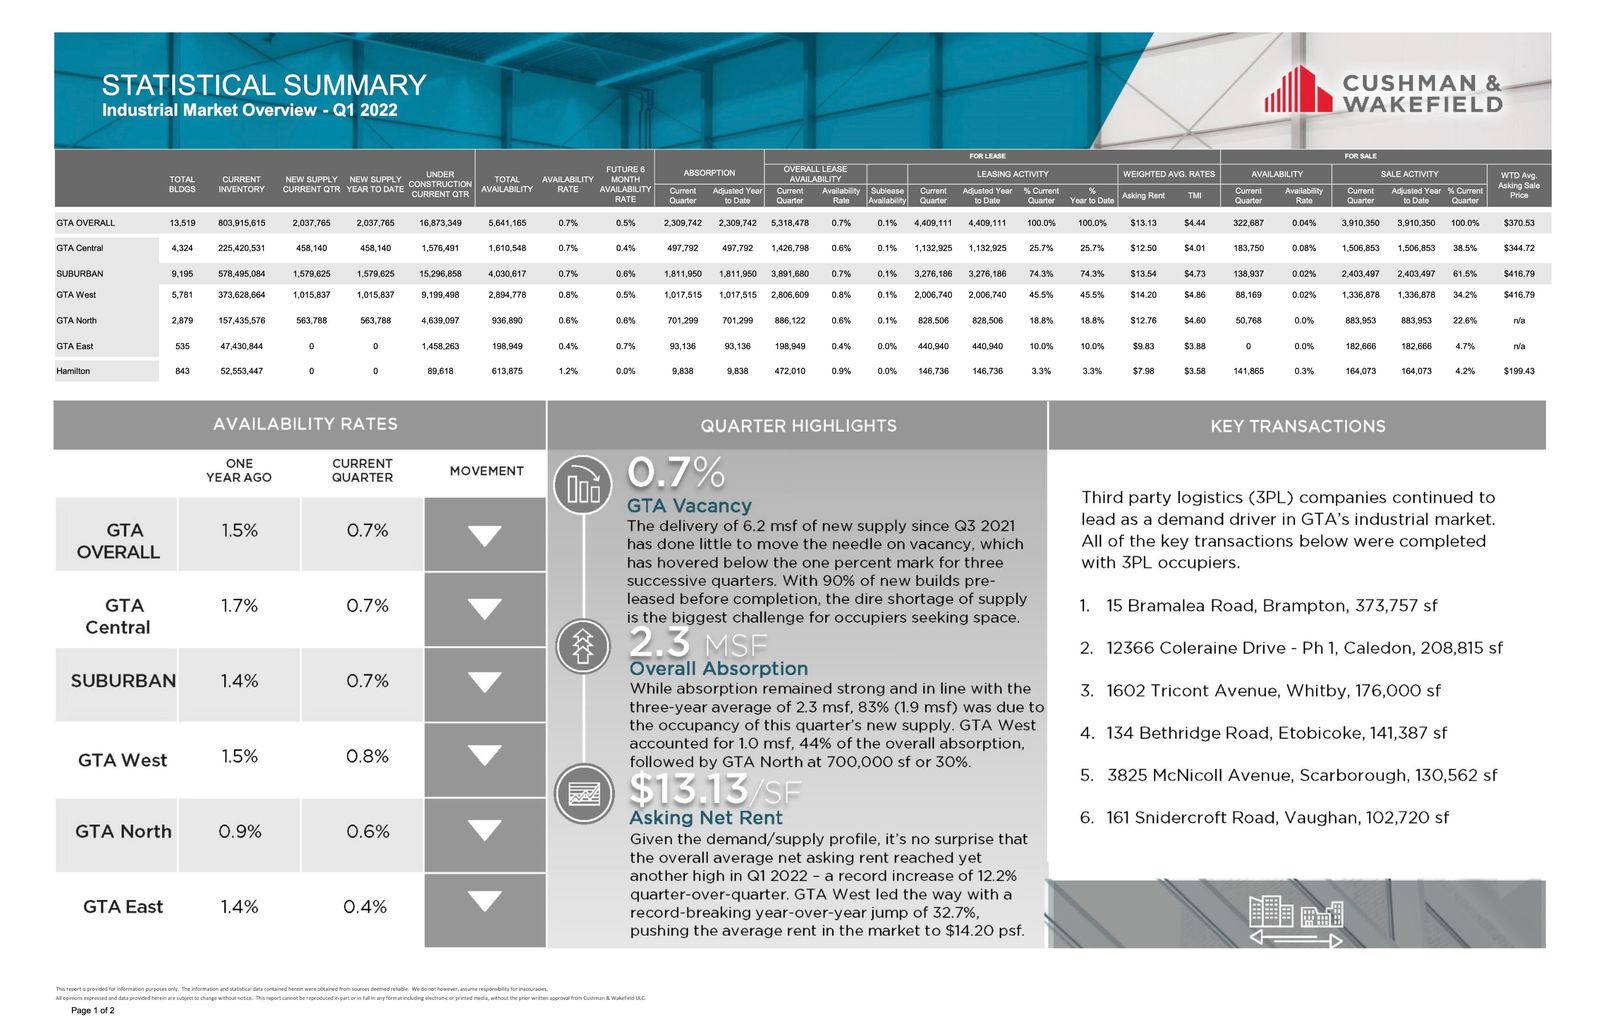
Q1 2022 GTA Industrial Market Overview – Source: Cushman & Wakefield
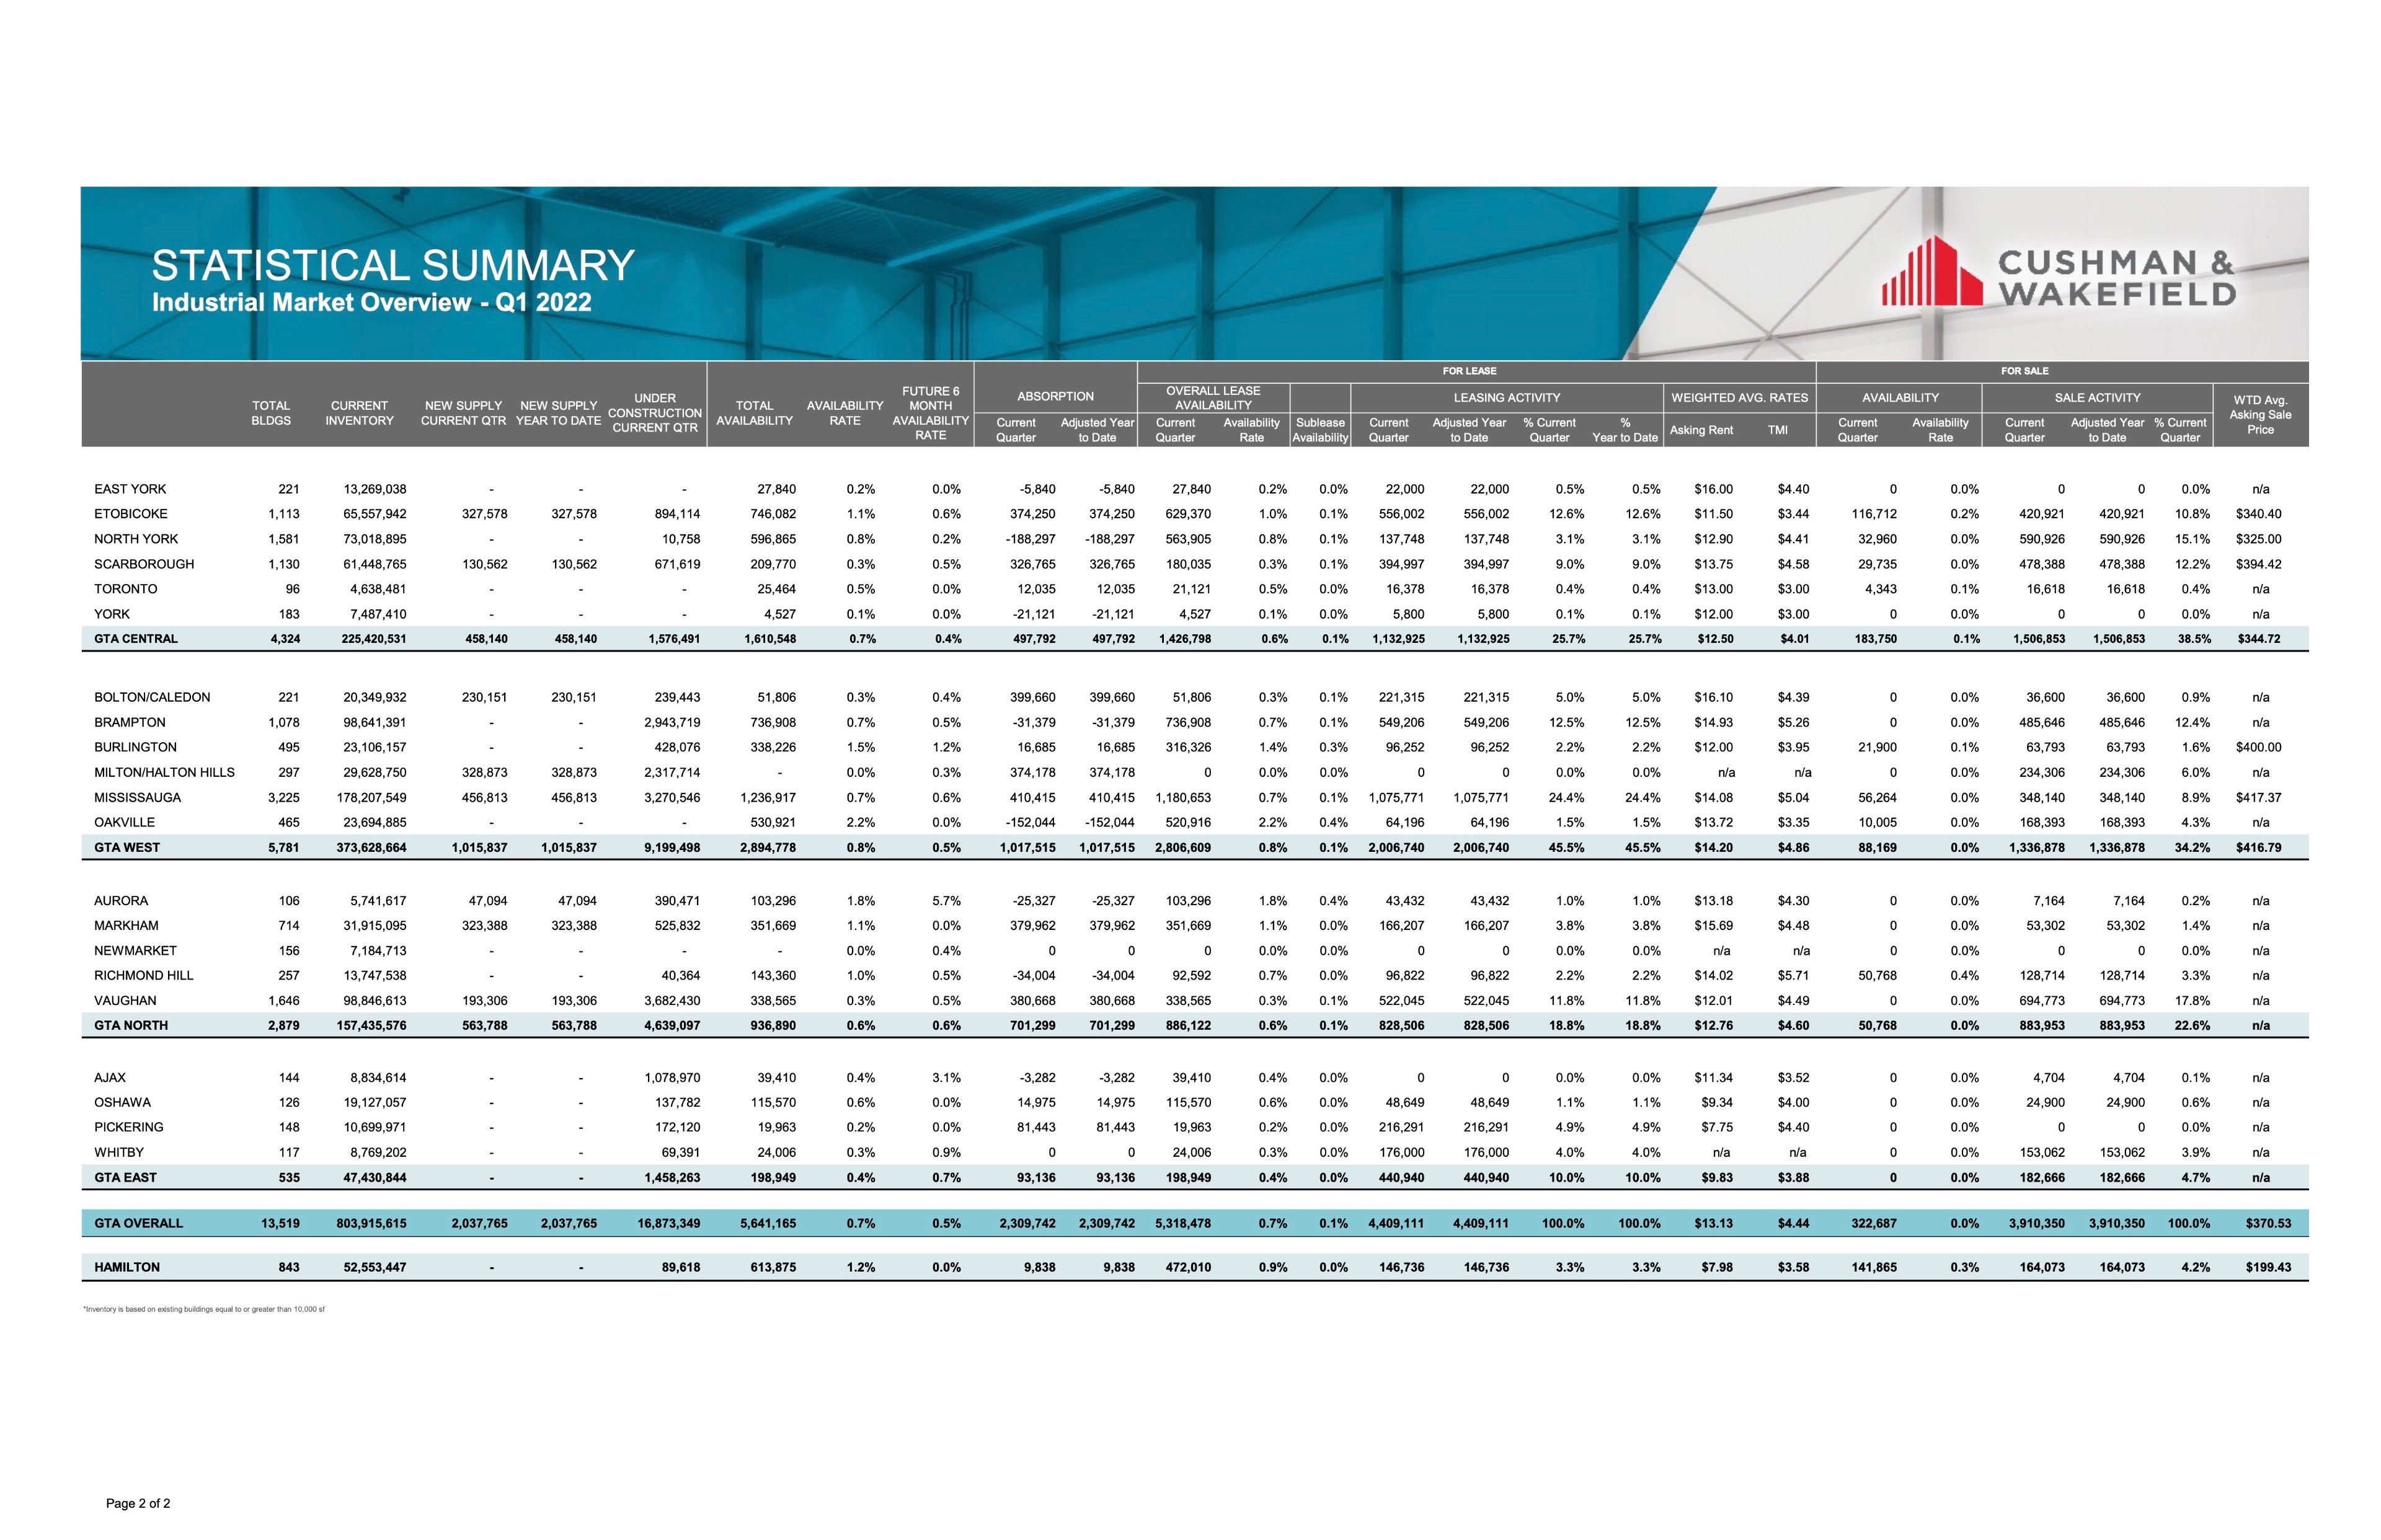
Q1 2022, Industrial Market Overview – Source: Cushman & Wakefield
GTA Central Markets (Scarborough)
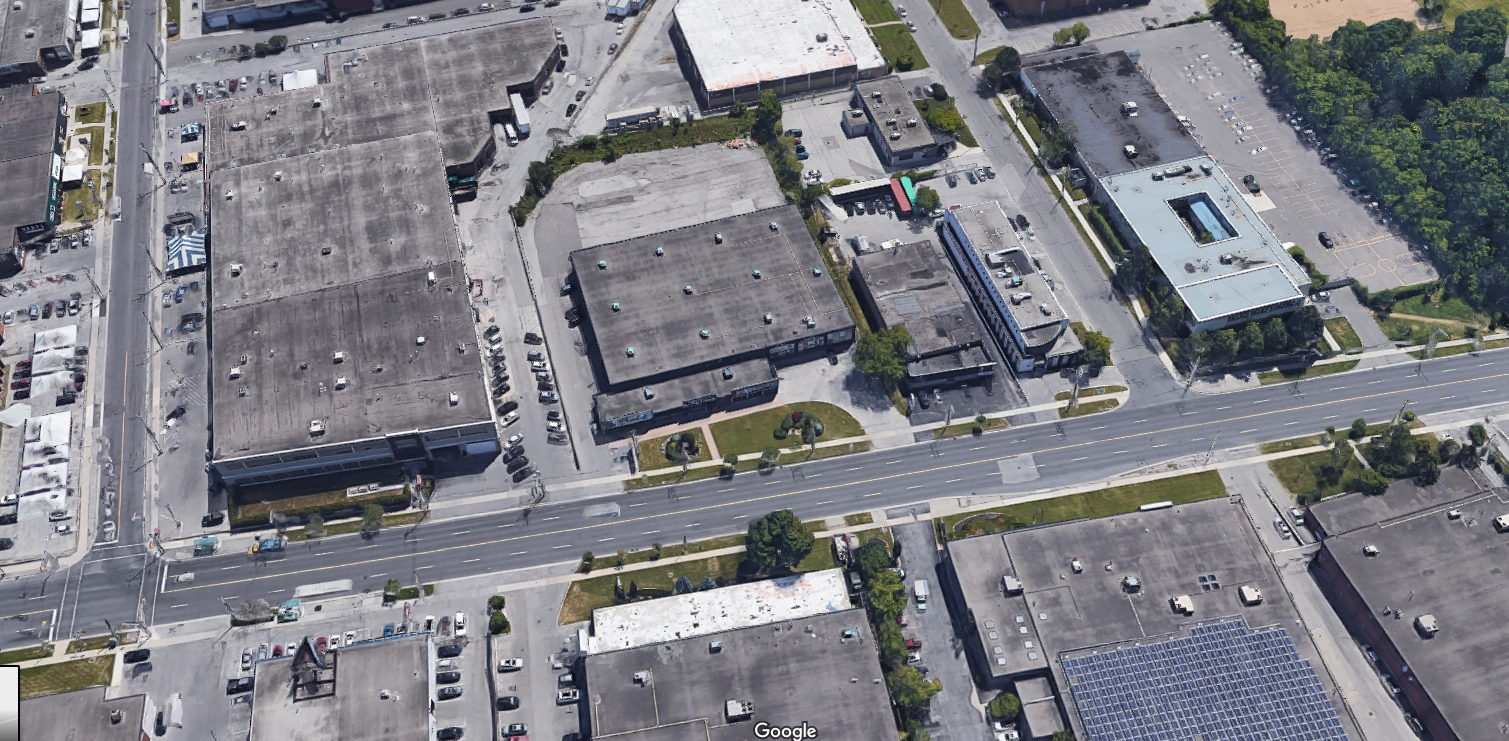
Properties Sold between January 2022 – March 2022, from 20,000 SF plus
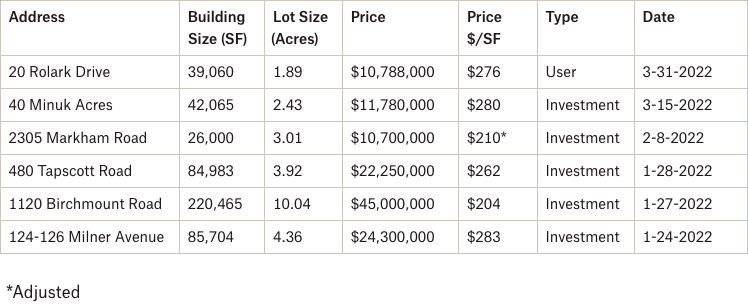
1120 Birchmount Road, Scarborough
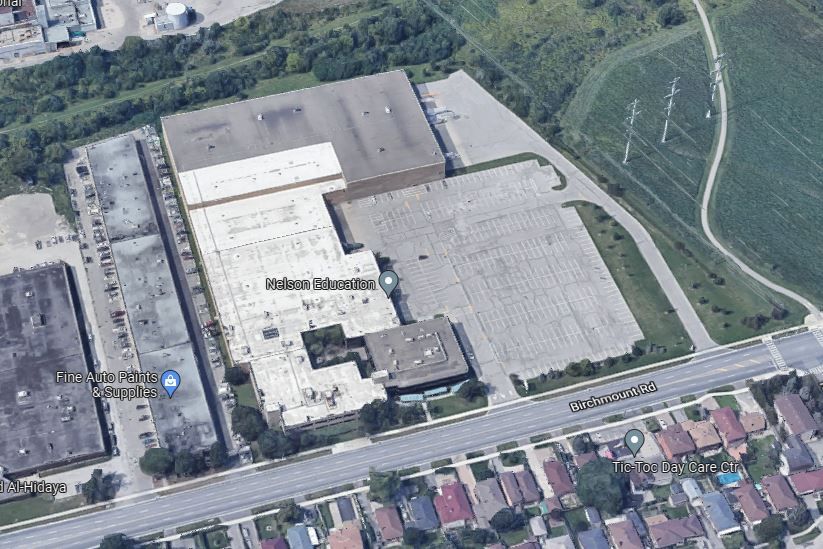
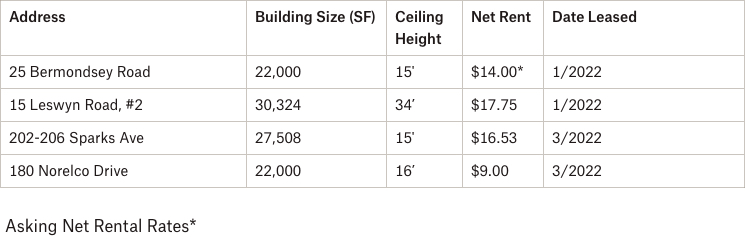
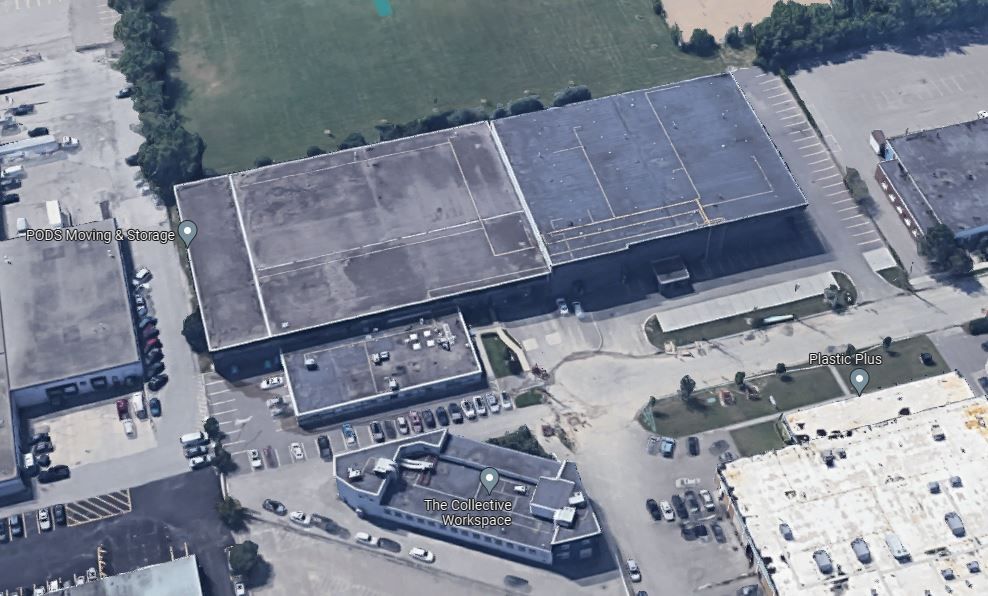
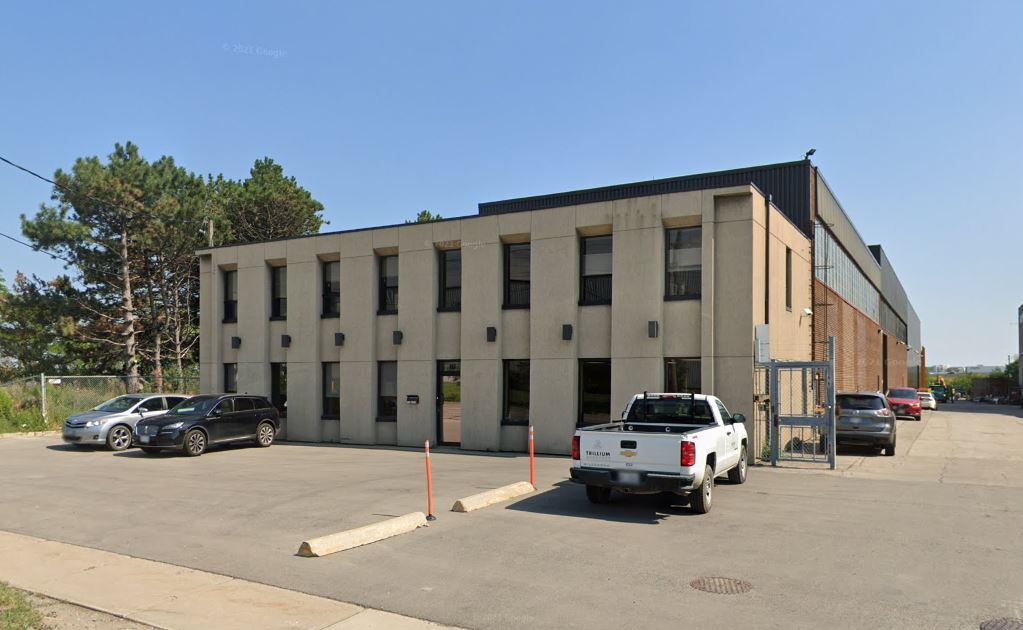
Properties Leased between January 2022 – March 2022, from 20,000 SF plus
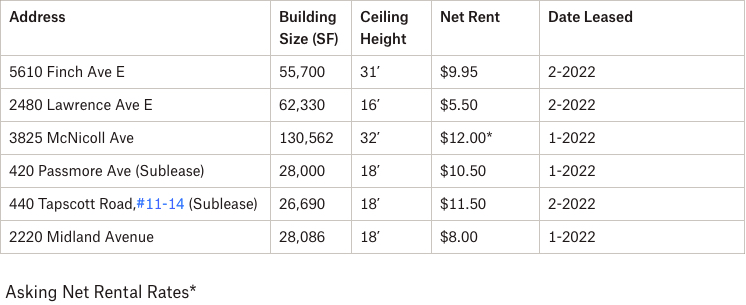
5610 Finch Ave E, Scarborough
Properties Sold between January 2022 – March 2022, from 20,000 SF plus

1177 Caledonia Road, North York
Properties Leased between January 2022 – March 2022, from 20,000 SF plus
Properties Sold between January 2022 – March 2022, from 20,000 SF plus

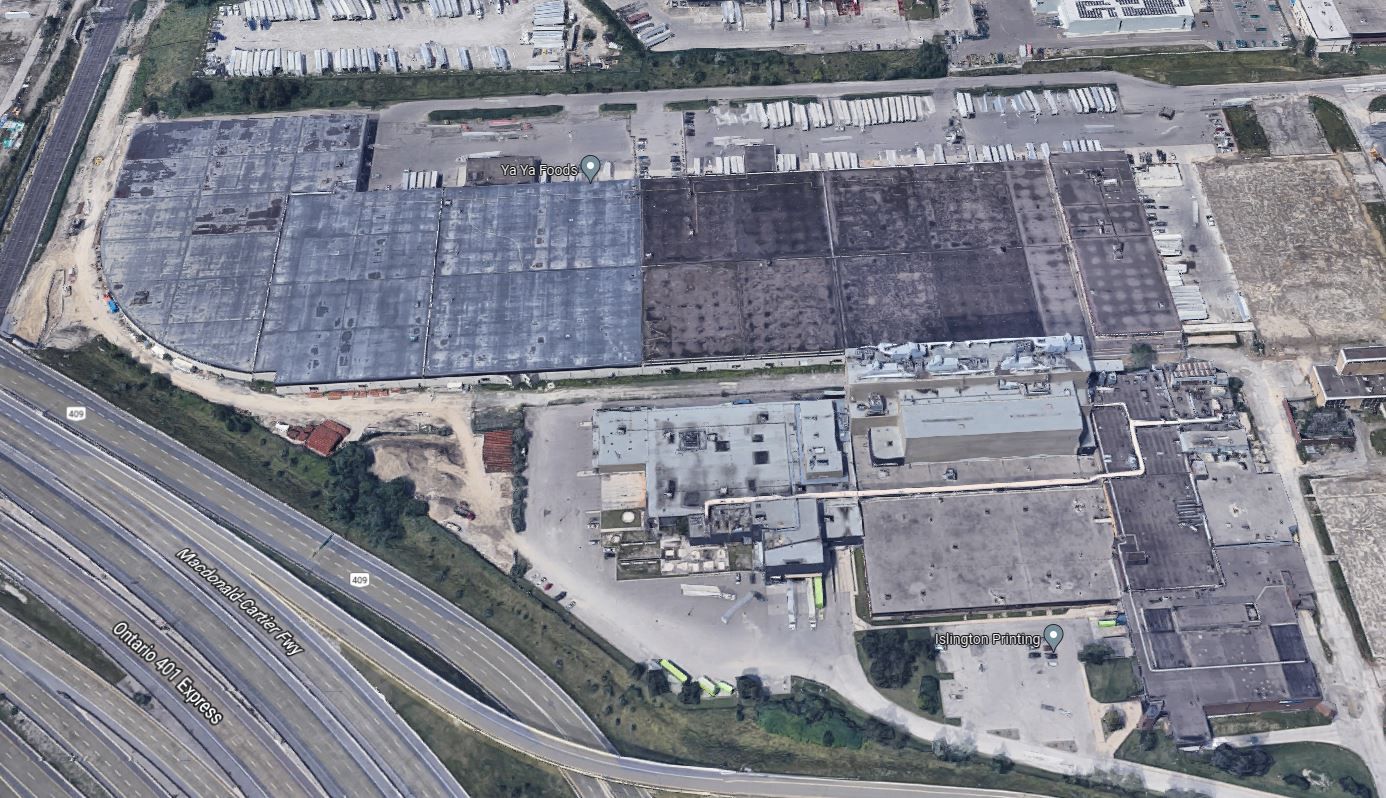
117 Disco Road, Etobicoke
Properties Leased between January 2022 – March 2022, from 20,000 SF plus

2200 Islington Avenue, Etobicoke
- Rental Rates: We continue to see a general upward pressure across the board into double-digit territory, depending on a number of factors, such as building size, location, ceiling height, etc. Based on the increase of value of industrial land, infill sites, construction costs, etc… we will see these rates continuing to grow. Overall, we are still in a Landlord’s market.
- Property Values: Values continue to increase, depending on the building size and location. We see pricing exceed $400 PSF, and more. CAP rates are somewhere between 3.5% to 4.5% but it really depends on the rental rates in place. If we have older rental rates with immediate growth potential, then CAP rates could end up below this range.
- Development Opportunities: Looking across the Toronto-Central markets, there is still great interest from developers to purchase infill sites and redevelop older and obsolete industrial buildings to newer, modern distribution centres. Given its central location and proximity to major highways and labour, larger industrial sites in the Toronto-Central markets will continue to be in great demand.
Conclusion:
So, how much is your property really worth?
What rental rate can you expect or how much per SF would you be able to get if you sell your building? How much can we compress CAP rates to create even greater value?
Well, the answers to these questions will depend on a variety of factors, many of which we can quickly uncover in an assessment of your situation. And with our rental rates and valuations at all-time highs, and vacancy rates low, finding the right property is a real challenge.
Having said that, a lot of transactions are being done off the market.. and to participate in that, you should connect with experienced brokers that have long-standing relationships with property owners.
For a confidential consultation or a complimentary opinion of value of your property please give us a call.
Until next week…
Goran Brelih and his team have been servicing Investors and Occupiers of Industrial properties in Toronto Central and Toronto North markets for the past 29 years.
Goran Brelih is a Senior Vice President for Cushman & Wakefield ULC in the Greater Toronto Area.
Over the past 29 years, he has been involved in the lease or sale of approximately 25.7 million square feet of industrial space, valued in excess of $1.6 billion dollars while averaging between 40 and 50 transactions per year and achieving the highest level of sales, from the President’s Round Table to Top Ten in GTA and the National Top Ten.
Specialties:
Industrial Real Estate Sales and Leasing, Investment Sales, Design-Build and Land Development
About Cushman & Wakefield ULC.
Cushman & Wakefield (NYSE: CWK) is a leading global real estate services firm that delivers exceptional value for real estate occupiers and owners. Cushman & Wakefield is among the largest real estate services firms with approximately 53,000 employees in 400 offices and 60 countries.
In 2020, the firm had revenue of $7.8 billion across core services of property, facilities and project management, leasing, capital markets, valuation and other services. To learn more, visit www.cushmanwakefield.com.
For more information on GTA Industrial Real Estate Market or to discuss how they can assist you with your real estate needs please contact Goran at 416-756-5456, email at goran.brelih@cushwake.com, or visit www.goranbrelih.com.
Connect with Me Here! – Goran Brelih’s Linkedin Profile: https://ca.linkedin.com/in/goranbrelih
Goran Brelih, SIOR
Senior Vice President, Broker
Cushman & Wakefield ULC, Brokerage.
www.cushmanwakefield.com
Office: 416-756-5456
Mobile: 416-458-4264
Mail: goran.brelih@cushwake.com
Website: www.goranbrelih.com